Basketball
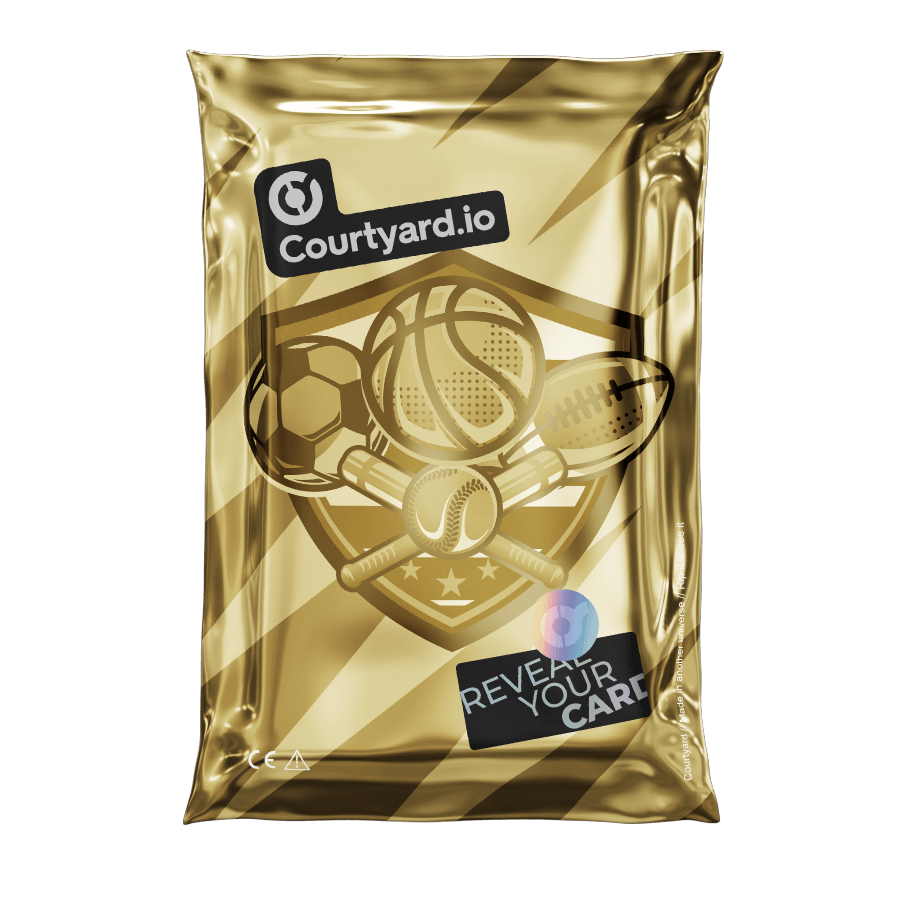
Sports Master Pack
Sports Master Pack is a $100 Courtyard Basketball mystery pack with a calibrated expected value of $103.80, worth $88.68 at its observed 85% buyback — a cash-out ratio of 0.887x (1.038x at sticker FMV), so it currently returns less than its price on the average rip once the buyback haircut is taken. 21.5% of 247 indexed pulls met or beat the pack price. Rip Advisor verdict: CAUTION (52/100).
Ranked #25 of 74 ranked packs by cash-out ratio, #5 of 12 Basketball packs.
Cash-out ratio
0.887x
$88.68 back on a $100 pack, at this pack's observed 85% buyback. At sticker FMV it is 1.038x.
95% range $77.52–$99.84, clear of the $100 price.
- Calibrated EV
- $104
- Cash-out EV
- $89
- Pack price
- $100
- Typical pull
- $86
- Hit rate
- 21.5%
- Lifetime EV
- $96
- Pulls indexed
- 247
- Last pull
- 6h ago
01 / Rip Advisor
Is Sports Master Pack worth it right now?
- Cash-out EV is $89 on a $100 pack (-11.3% net after the ~85% buyback) — the average rip loses money.
- Cash-out EV is $88.68, and the sample is precise enough to place it below the $100.00 price: the 95% range is $77.52 to $99.84, which does not include the price.
- The typical pull (median) is $86 — most rips return less than the pack price; the EV is carried by rare chase cards.
- Recent pulls are averaging 10.2% above where they were 7 days ago. A restock would look like this; so would a lucky week. We cannot see inventory, so this is a change in what came out, not a confirmed change in what is in there.
- Calibrated EV (recent pulls weighted) is $104 vs $96 lifetime — the pool has improved recently.
- 21.5% of pulls meet or beat the pack price, across 247 indexed pulls.
Downside · bottom-quartile rip
−$34
1 in 4 rips returns ≤ $66 cash — covering 66% of the price.
Upside · top-decile rip
+$11
1 in 10 rips returns ≥ $111 cash. Both figures use the observed buyback ratio.
Verdict is computed transparently from indexed pulls: cash-out ROI, median pull, 7-day trend, hit rate, and sample size. Redemption shipping (typically $16+) is not included — cards worth less than a few times the shipping cost are usually better instant-sold than shipped. Not financial advice.
02 / Pool signals
What's happening in the Sports Master Pack pool
EV up 10% in 7 days and recent pulls run above lifetime — a restock signal, not a confirmed restock.
EV up 10% in 7 days and recent pulls run above lifetime — a restock signal, not a confirmed restock.
Pro adds the Pool Health score and chase-removal impact.
Not observable: packs remaining, value remaining, and which chases are still in the pool — Courtyard publishes a pull feed, not inventory. We label those unavailable rather than estimate them. Everything above is computed from indexed pulls and EV snapshots; thin or stale data pulls the score toward neutral. Formula
Chase tracker
chase tier ≥ $500 · confidence 100%No chase-tier pulls (≥ $500) observed in the last 30 days.
Removals are facts; what's left is not. Each row is a unique graded card observed leaving this pack, so it is no longer in the pool — though a card can return after a buyback, which is why re-listings are flagged. We show no “chance it remains”: Courtyard publishes pulls, not inventory, so that number would be guesswork. Formula
Signal lifetime
SIGNAL Weakening · 6.9 h agoPull flow has slowed past the usual gap of 6.3 h, so this read is ageing faster than the pack is producing evidence. At the observed pull rate, half the evidence behind this read is replaced in about 2 months.
- Newest pull
- 6.9 h
- observed
- Pull rate
- 3.8/day
- observed
- Pulls, 7d
- 24
- observed
- Half-life
- Pro
Aged, not predicted. Half-life counts how fast new evidence arrives, measured from real pull timestamps — it is not a forecast of where EV is heading. We publish no EV-drift half-life because our snapshot history is still too short for a regression to mean anything. The seeded placeholder points this note used to warn about have been flagged in the database and excluded from every chart, trend and score, so what you see plotted is observed data. Note the headline EV is decay-weighted, so it reacts to new pulls sooner than this whole-sample horizon implies. Methodology
03 / Contents
What has come out of Sports Master Pack
By era
Cards seen range from 1952 to 2025.
- Current (2020+)53%$99 avg
- Vintage (pre-2000)36%$92 avg
- Modern (2010-2019)7%$105 avg
- Retro (2000-2009)3%$82 avg
Most common sets
Sets these pulls came from.
- Topps24%$95 avg
- Topps Now4%$81 avg
- Topps Chrome3%$84 avg
- Panini Donruss Optic3%$107 avg
- Panini Prizm3%$103 avg
- Bowman Draft2%$77 avg
- Panini Select2%$145 avg
- Upper Deck2%$86 avg
Cards seen most often
Named on 99% of readable pulls. The rest do not print a card number, and without one the card cannot be told apart from the set name.
- Victor Wembanyama6%$110 avg
- Michael Jordan6%$87 avg
- Cooper Flagg4%$81 avg
- LeBron James3%$113 avg
- Kon Knueppel2%$88 avg
- Stephen Curry2%$92 avg
- Luka Doncic2%$83 avg
- Kobe Bryant2%$90 avg
Built from the 247 indexed pulls of this pack so far — a record of what has come out, not a promise about what is left.
04 / Floor safety
Sports Master Pack floor safety & buyback reality
In Sports Master Pack, the top 2% of pulls account for 6% of all pulled value — low dilution. Value is spread fairly evenly across the pool, so the average is close to what a typical rip returns. The observed instant-offer ratio is 86% of FMV, which is the cash number every verdict on this page already uses.
Floor safety
low dilution6% of everything this pack has paid out came from just the top 2% of pulls. Value is spread broadly across pulls, so the average sits closer to the typical rip here than it does on a top-heavy pack. It still sits above the median — check both.
Buyback reality
85.4% of FMV observedAcross 238 indexed pulls that carry a recorded bid, a $100 FMV pull cashes out around $85 if you instant-sell — better than the platform's 84.6%. This is the figure every verdict on the site multiplies by.
Holding, listing, or physically redeeming can beat the instant offer — but redemption shipping (typically $16+) eats small wins.
Net exit value
238 paired pulls · 96% bid coverage · confidence 100%Instant-selling the average (mean) pull here returns $82.51 — $14.07 below sticker FMV (14.6% haircut). That figure is the average of bids we actually recorded, not the platform rate applied blind.
Pro compares all three exits side by side, with the redemption breakeven and the value-by-value haircut curve for this pack.
Bids are recorded, resale is not. Instant-buyback figures are real offers captured at index time and can move. Redemption shipping starts near $16 in the US, is higher internationally, and is charged per shipment — batching pulls lowers it. We publish no resale estimate, liquidity score, or time-to-sell, because no such data is available to us. How buyback works
05 / Observed odds
Sports Master Pack odds — observed, not posted
Across 247 indexed pulls, 21.5% returned at least the $100 pack price and 2.4% returned double or more; the single best recorded pull is $340.
- Under $50
- $50 – $100
- $100 – $200 · beats the pack
- $200 – $500 · big hit
- $500+ · chase
Observed across 247 indexed pulls — what actually came out of this pack, independent of the posted odds. The 48h column shows tier drift: a falling green tier means fewer of the good cards have come out lately — which may mean they are running out, or may just be a quiet 48 hours.
06 / Simulator
Sports Master Pack rip simulator
- Cost
- $500
- Expected cash-out
- $443
- Expected net
- -$57
- ≥1 hit chance
- 70.1%
Recent pool: pulls are weighted so newer ones count for more, the same basis as this pack’s headline, verdict and the budget tool. The 247 pulls behind the hit chance are unweighted either way, and the 85% buyback is applied to both. These two disagree here: -$11.32 per pack recent-weighted against -$17.88 all-time. The pool has moved, so which number you want depends on whether you think the recent run continues. Averages describe many rips — any single rip can land anywhere on the distribution.
Monte Carlo · 10,000 trials
P(profit) 10.9%
Mean net −$89
Cost $500
- Worst 5%
- −$163
- Bottom quartile
- −$138
- Median
- −$108
- Top quartile
- −$59
- Best 5%
- +$58
Bootstrap resampling of 247 observed pulls with the 85% cash-out applied. Every pull is drawn with equal probability, so this is an all-time average: it will sit below the headline whenever the recent pool has run better than the lifetime one, and above it when the reverse is true. It also assumes the pool doesn't change as you rip — for top-heavy packs the downside is understated once the grail leaves. Estimates, not financial advice.
07 / Big hits
Biggest Sports Master Pack pulls
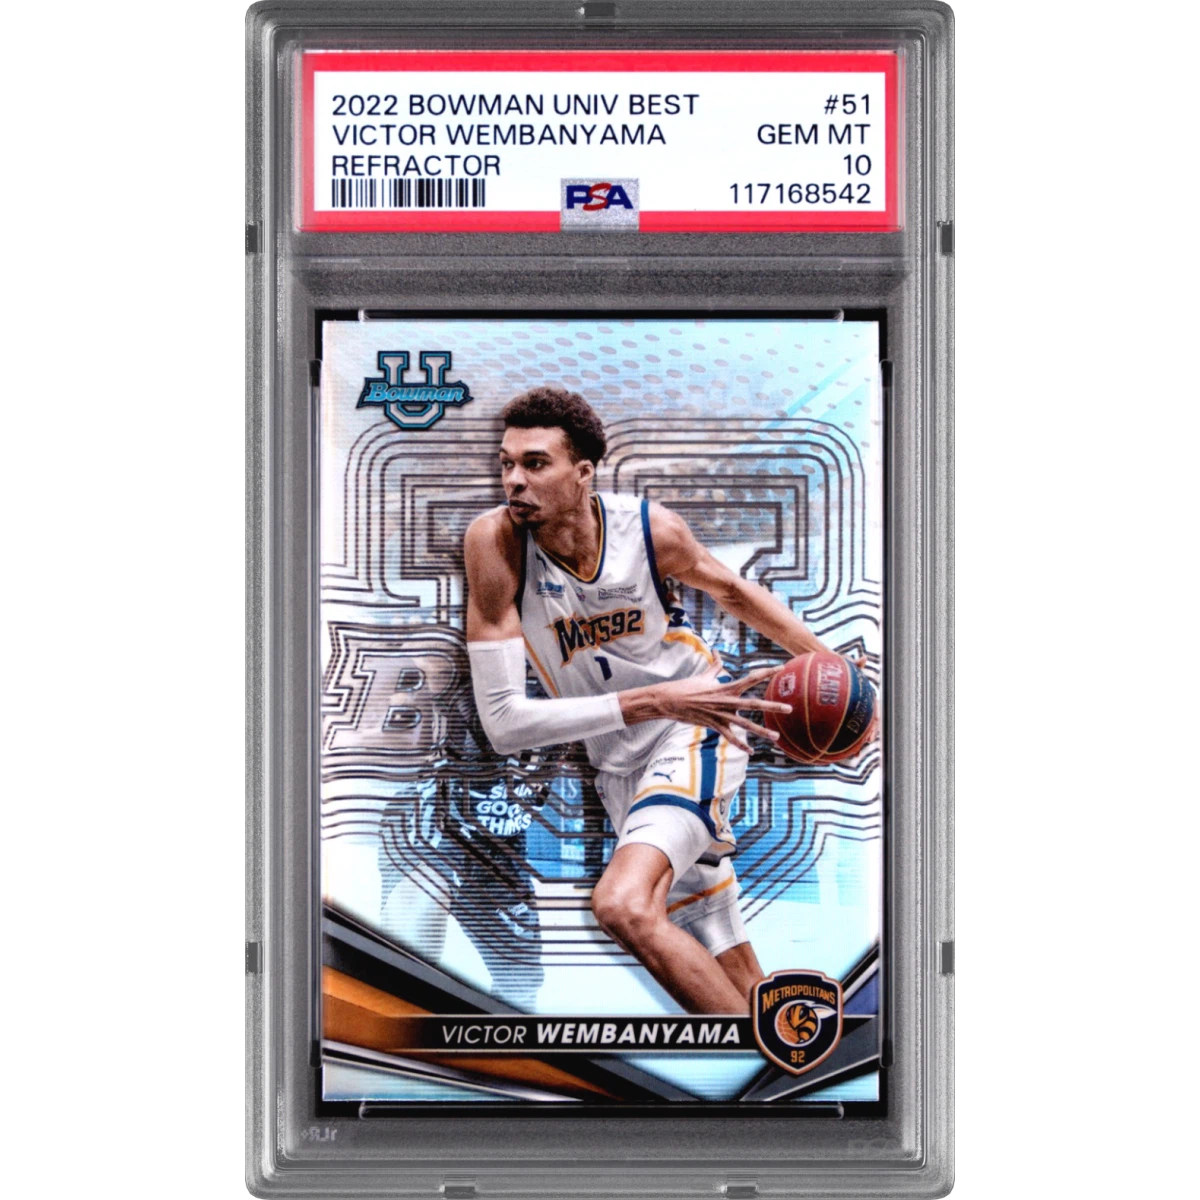
2022 Bowman University Best #51 Victor Wembanyama - Refractor (PSA 10 GEM MINT)
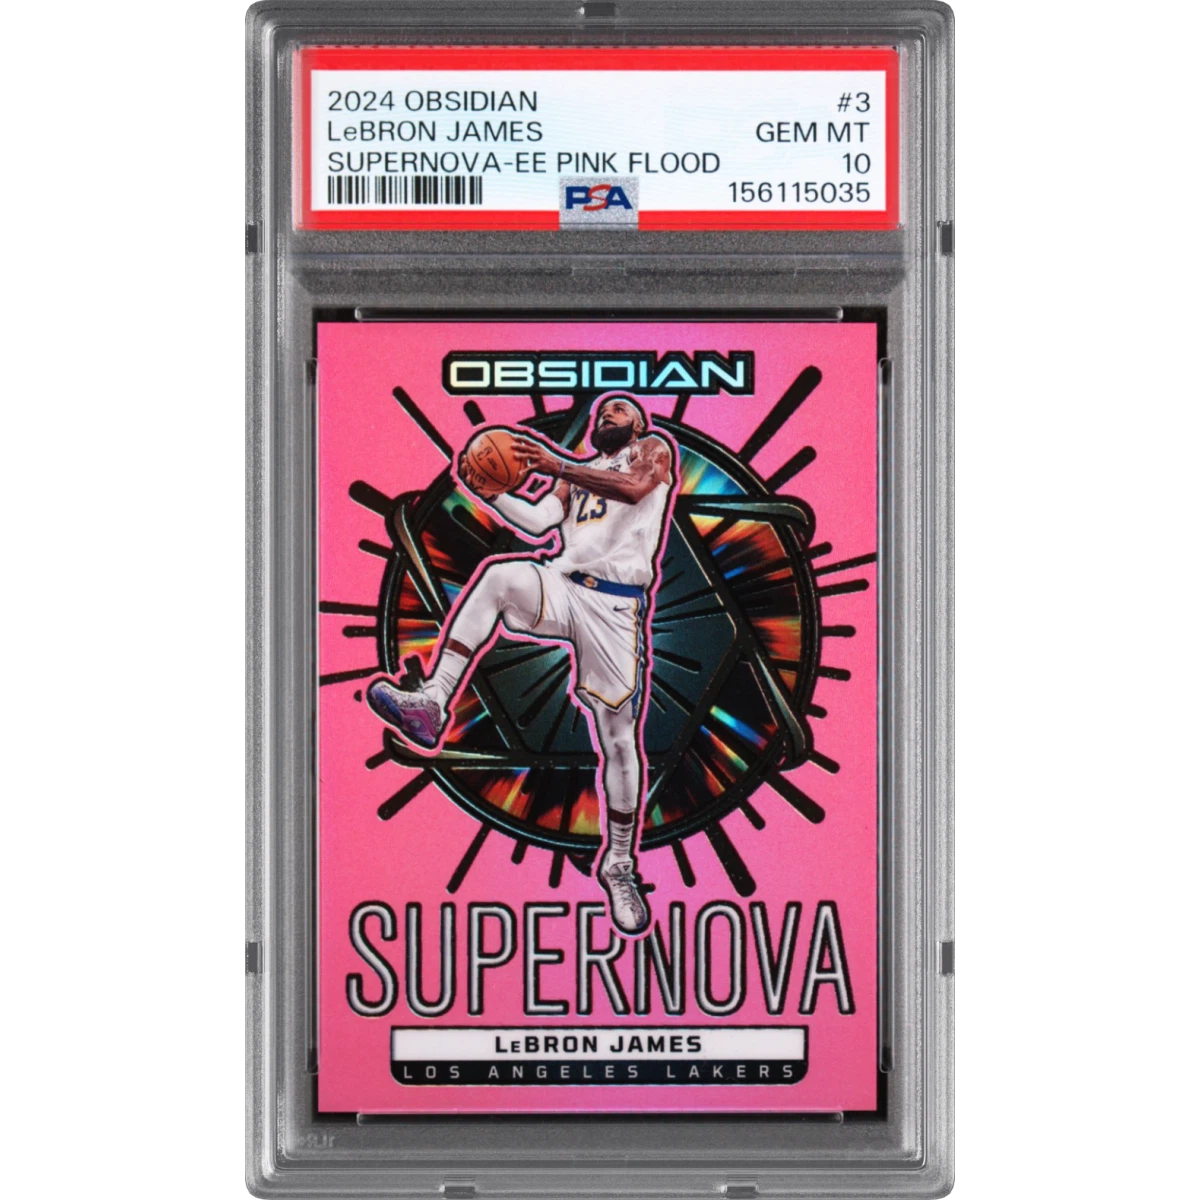
2024 Panini Obsidian Supernova #3 LeBron James - Electric Etch Pink Flood (PSA 10 GEM MINT)
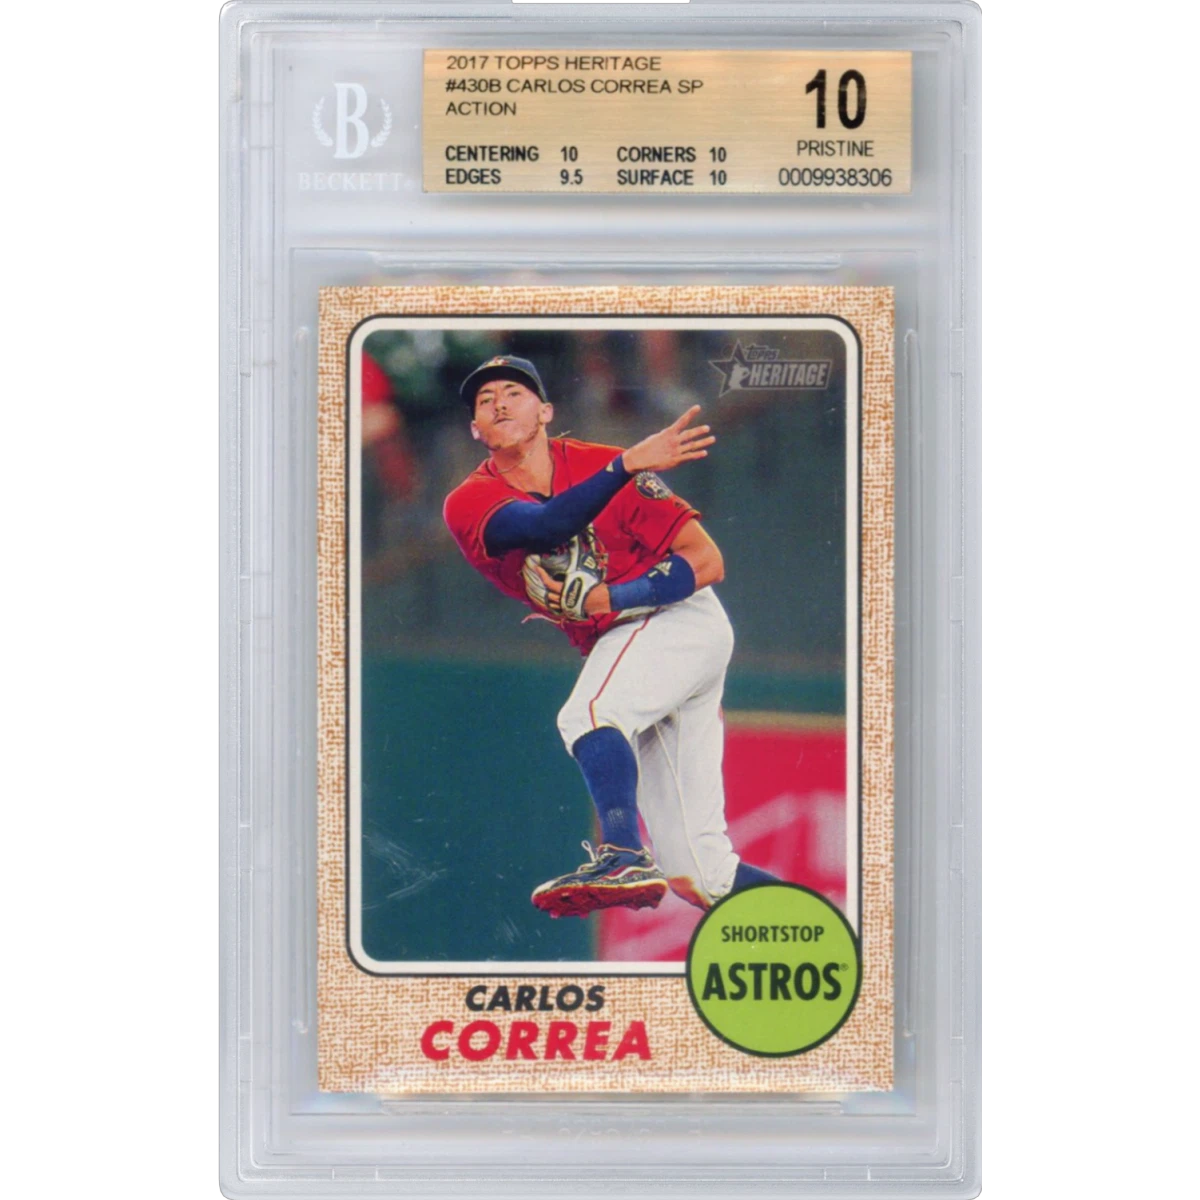
2017 Topps Heritage #430 Carlos Correa - Action (BGS 10 PRISTINE)
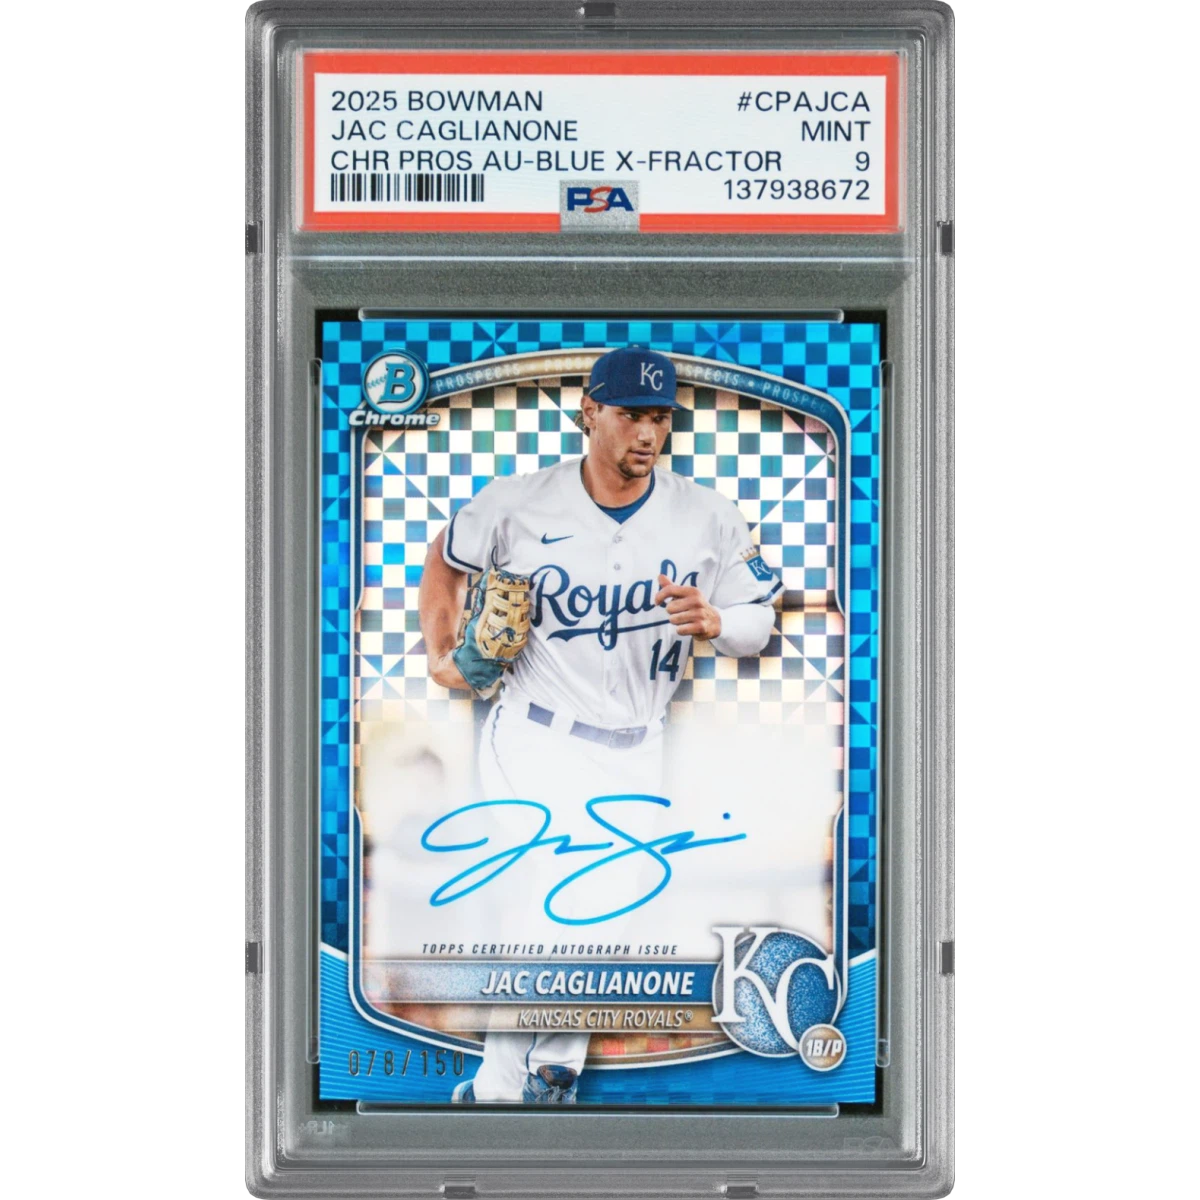
2025 Bowman Chrome Prospect Autographs #CPAJCA Jac Caglianone - Blue X-Fractor (PSA 9 MINT)
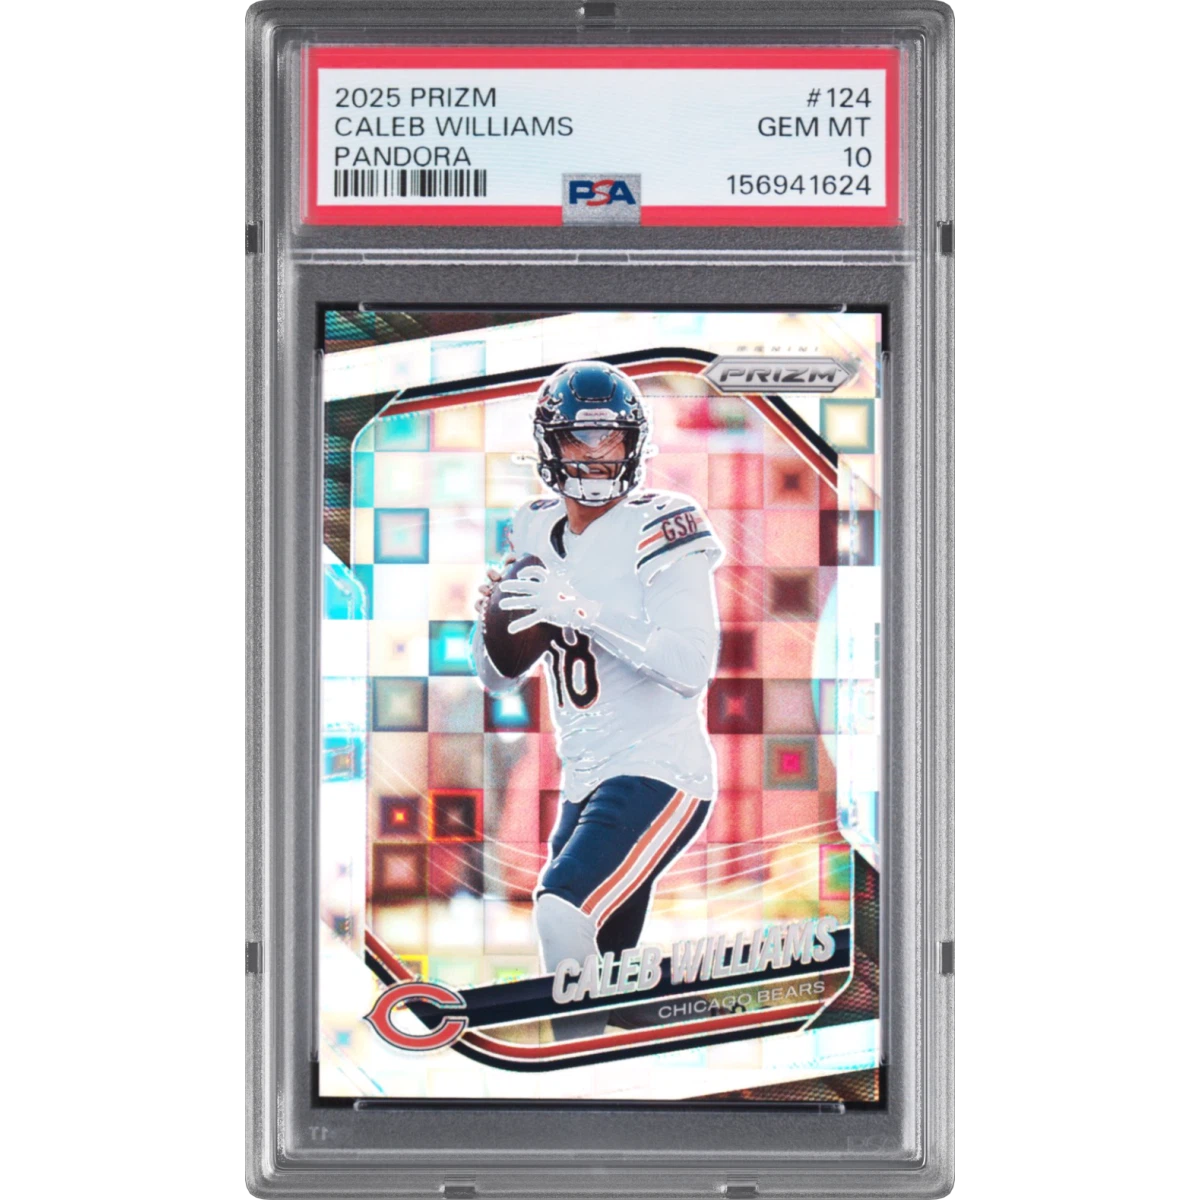
2025 Panini Prizm #124 Caleb Williams - Pandora (PSA 10 GEM MINT)
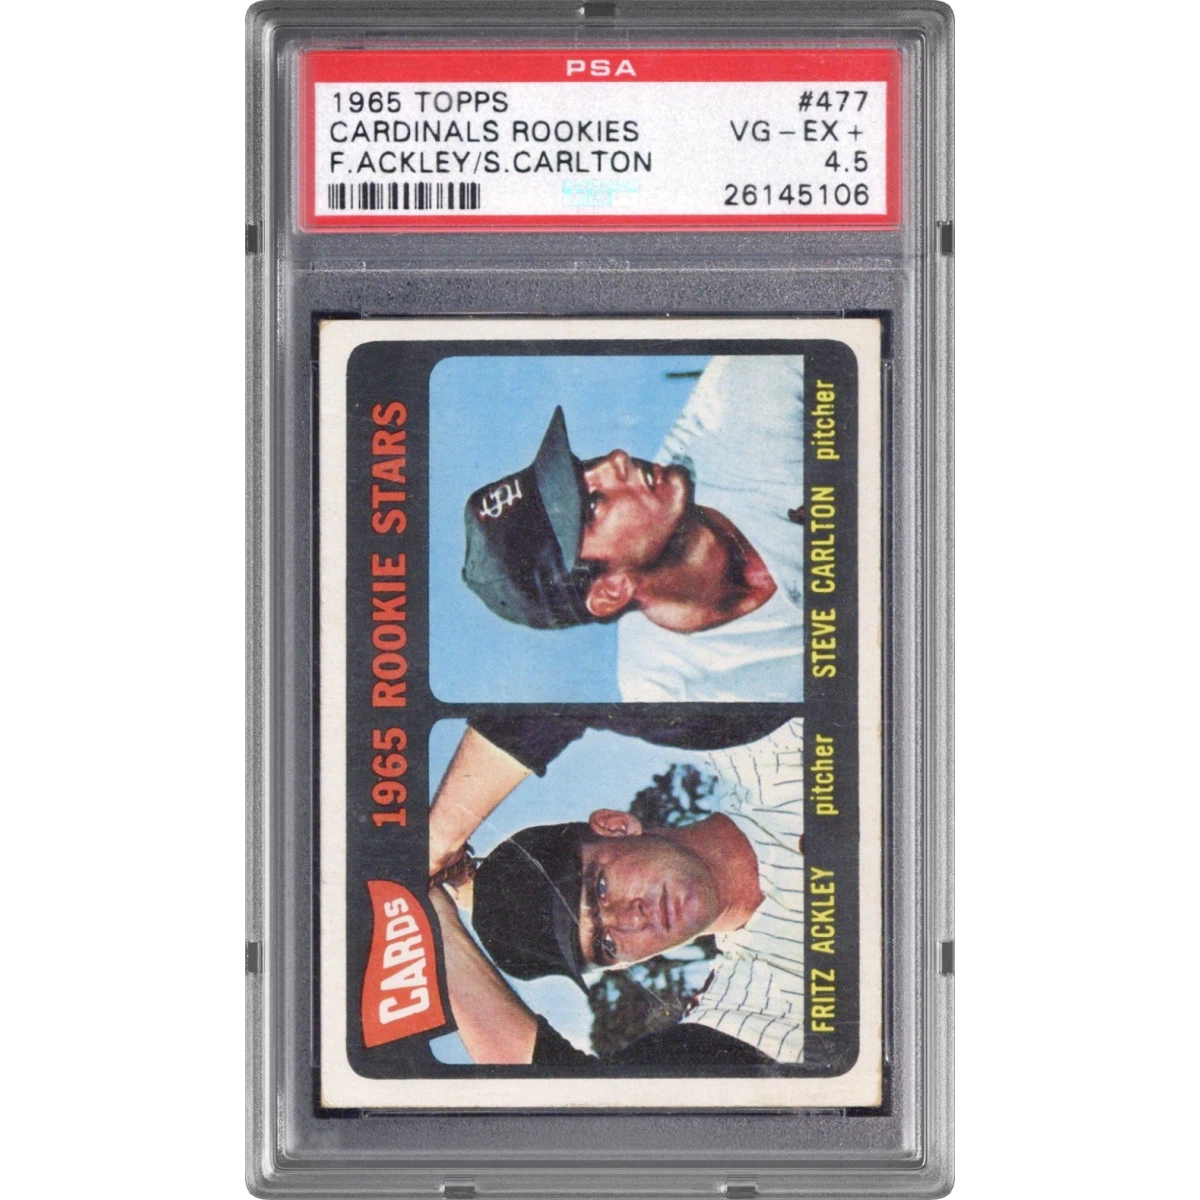
1965 Topps #477 Cardinals Rookies - Fritz Ackley/Steve Carlton (PSA 4.5 VG-EX+)
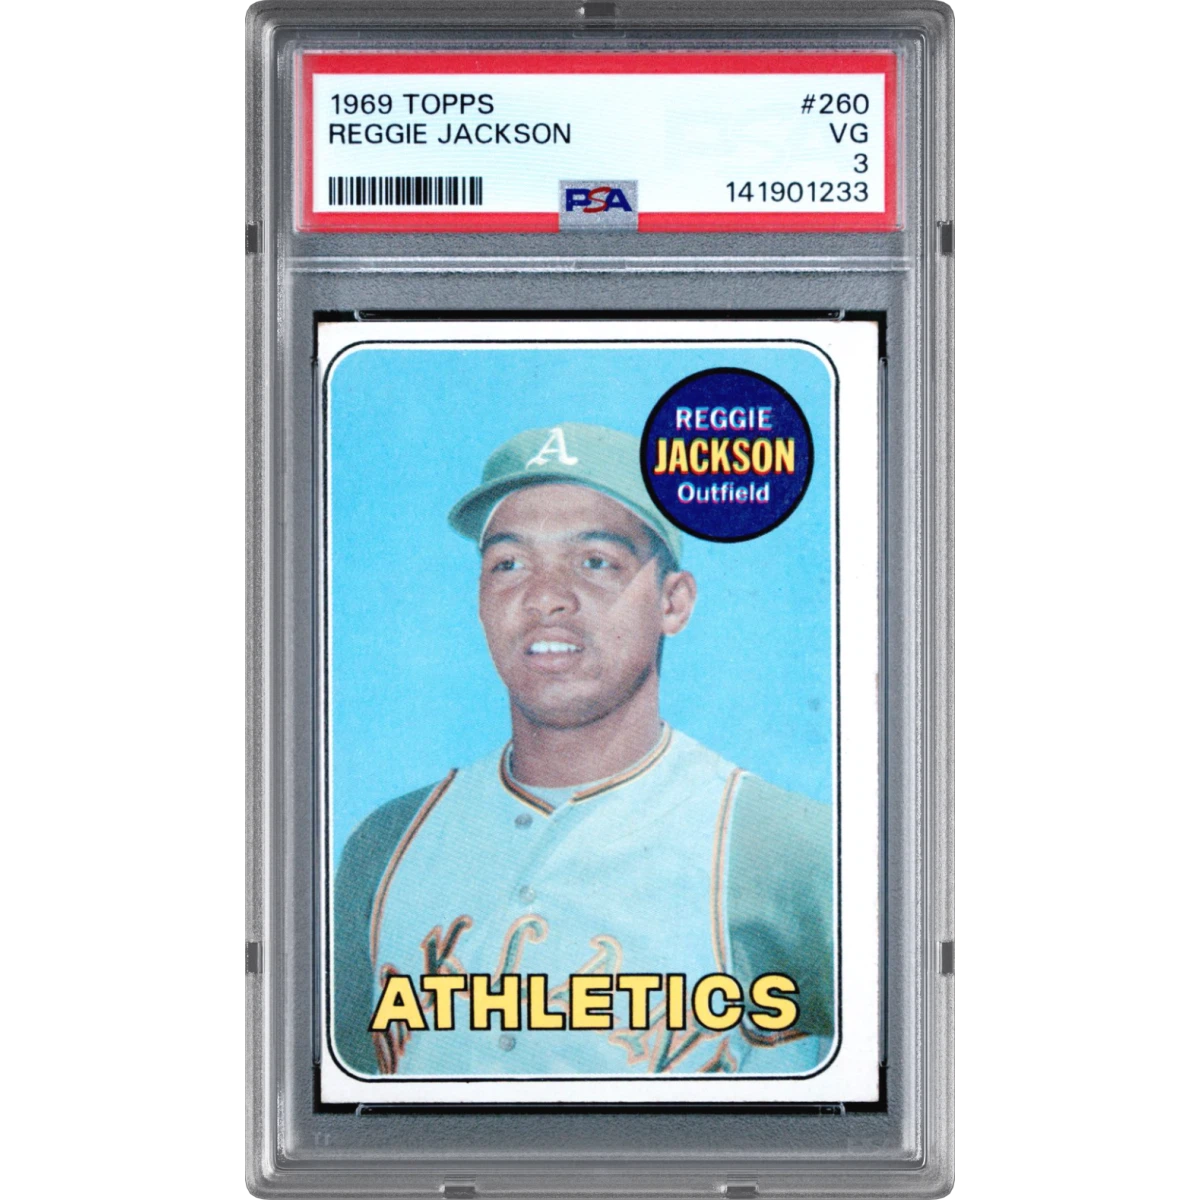
1969 Topps #260 Reggie Jackson (PSA 3 VG)
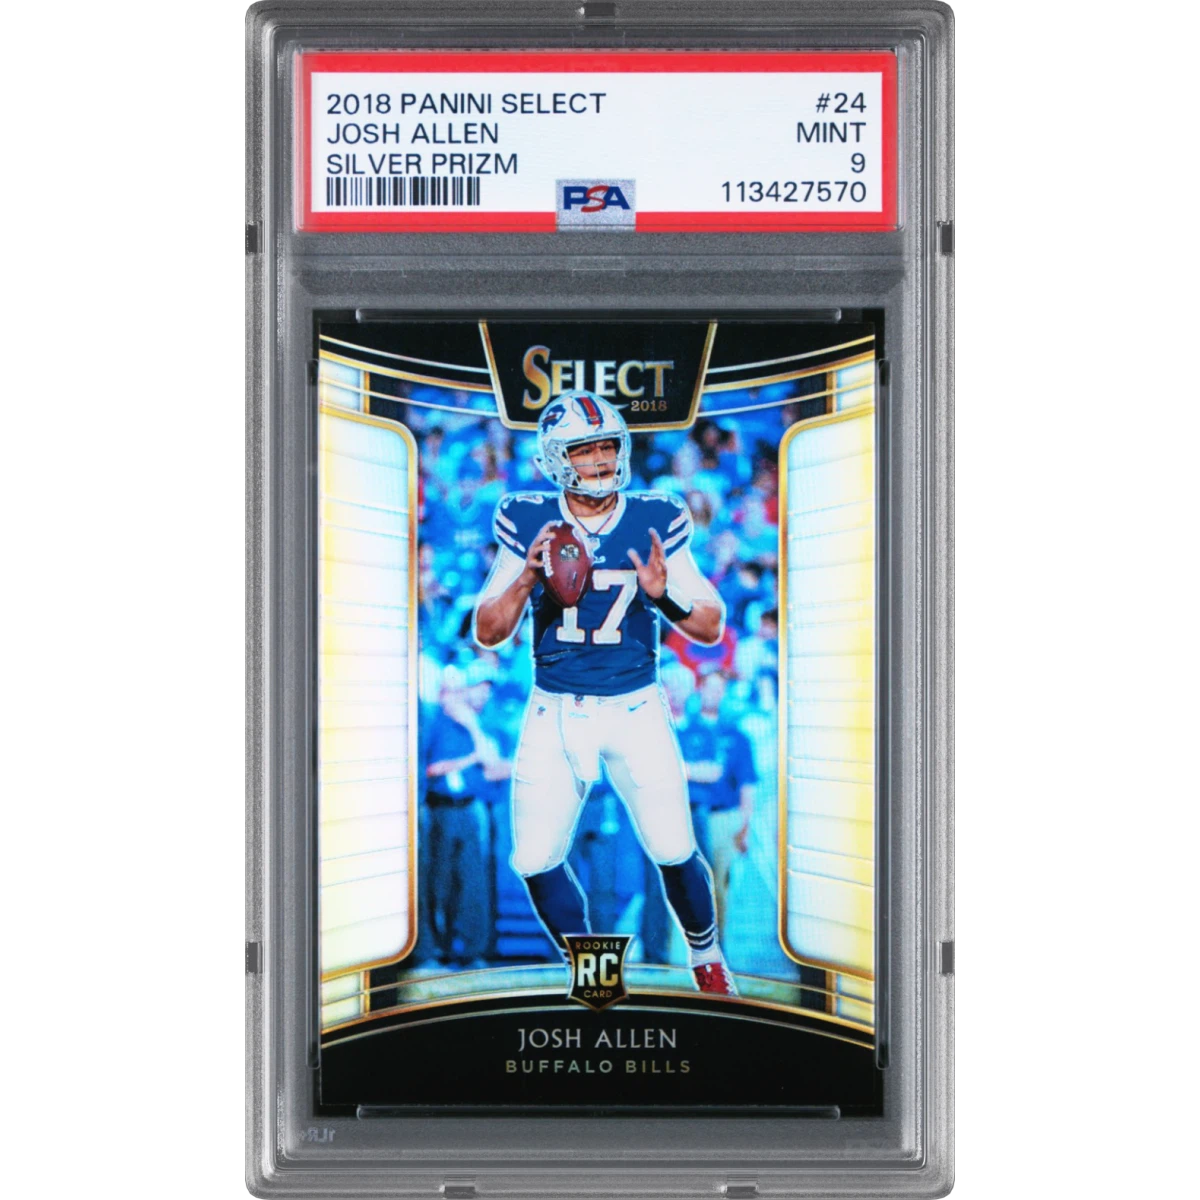
2018 Panini Select #24 Josh Allen - Silver Prizm (PSA 9 MINT)
08 / EV history
Sports Master Pack EV over time
Calibrated EV currently sits at $103.80, above the $100 pack price, and has moved up 10.2% over the last 7 days.
Cash-out ratio over time: 539 points from Oct 19 to Oct 25, starting at 0.81x and ending at 0.89x, up overall (+10.2%), ranging between 0.77x and 0.93x.
09 / Quick answers
Sports Master Pack — quick answers
- Is Sports Master Pack worth buying right now?
- Our current verdict is CAUTION (score 52/100). Cash-out EV is $89 on a $100 pack (-11.3% net after the ~85% buyback) — the average rip loses money.
- What is the EV of Sports Master Pack?
- The calibrated EV is $103.80 against a pack price of $100.00, with a typical (median) pull of $86.20 across 247 indexed pulls.
- What are the real odds of beating the pack price on Sports Master Pack?
- 21.5% of indexed pulls met or beat the pack price, and 2.4% returned at least double the price. These are observed odds reconstructed from real pulls, not the posted odds.
- What is the typical pull from Sports Master Pack?
- The median pull is $86.20 — half of all indexed rips returned less than that. The single best recorded pull is $340.10.
10 / Pull log
Latest Sports Master Pack pulls
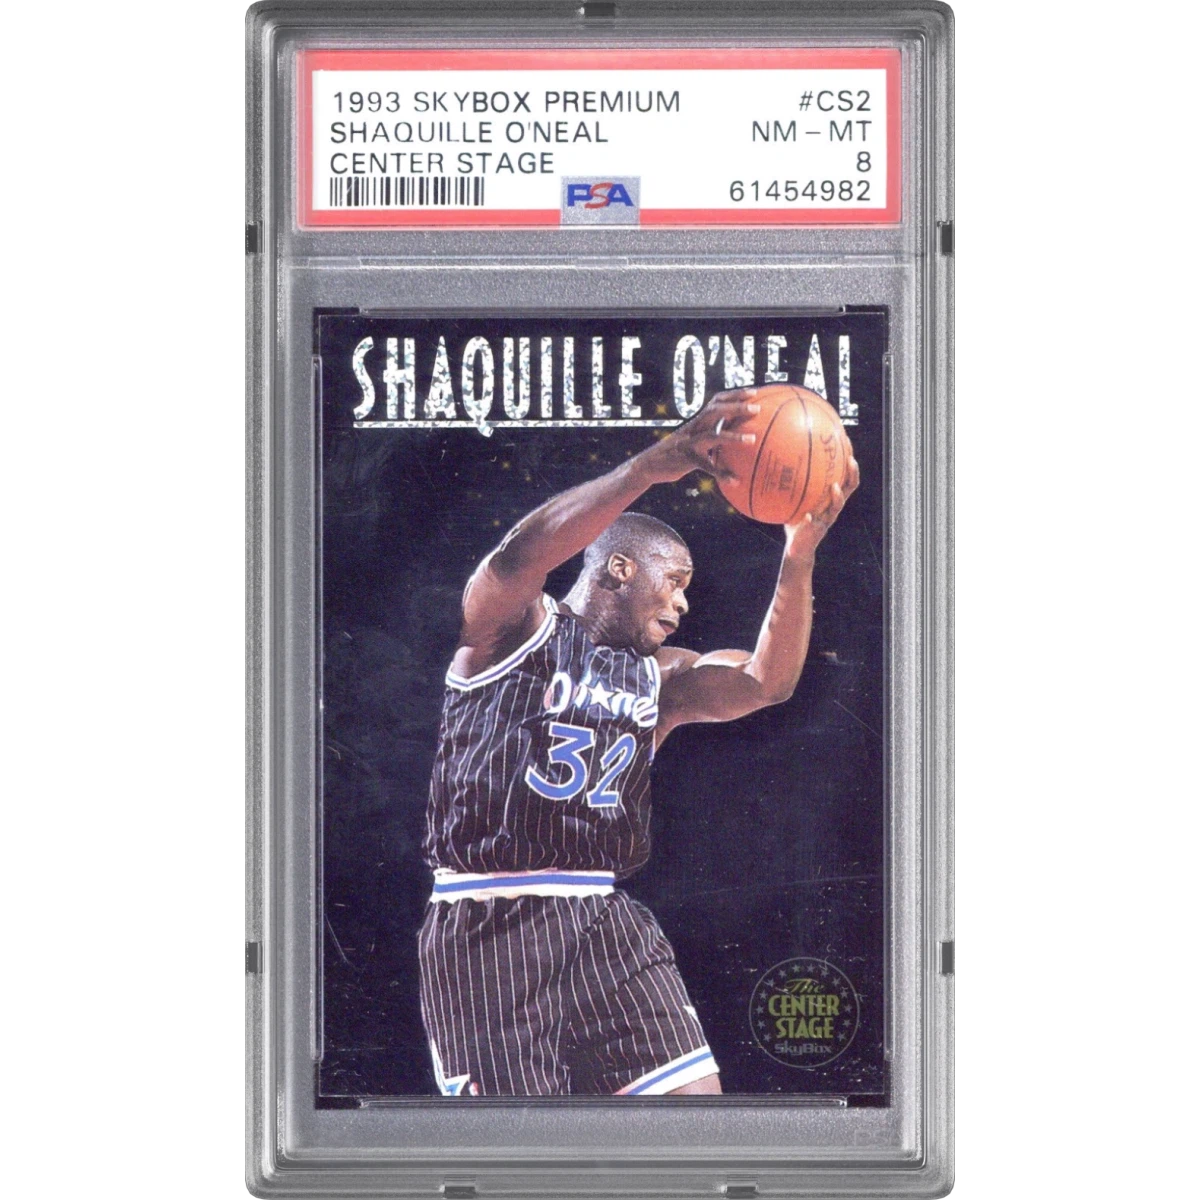 1993 Skybox Premium Center Stage #CS2 Shaquille O'Neal (PSA 8 NM-MT)$80.006h ago
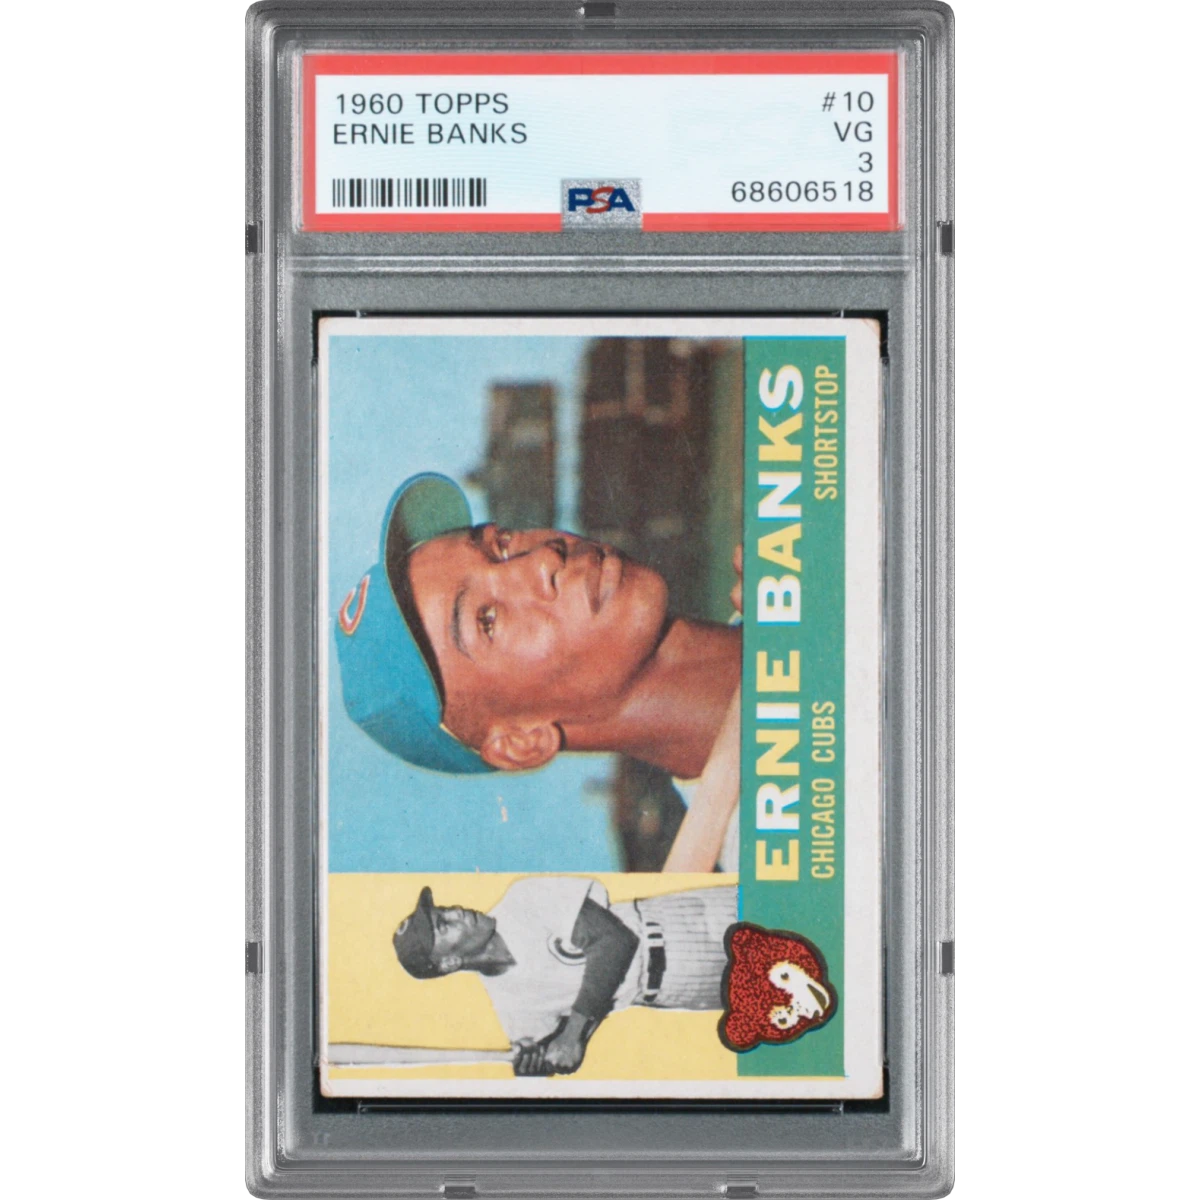 1960 Topps #10 Ernie Banks (PSA 3 VG)$70.6012h ago
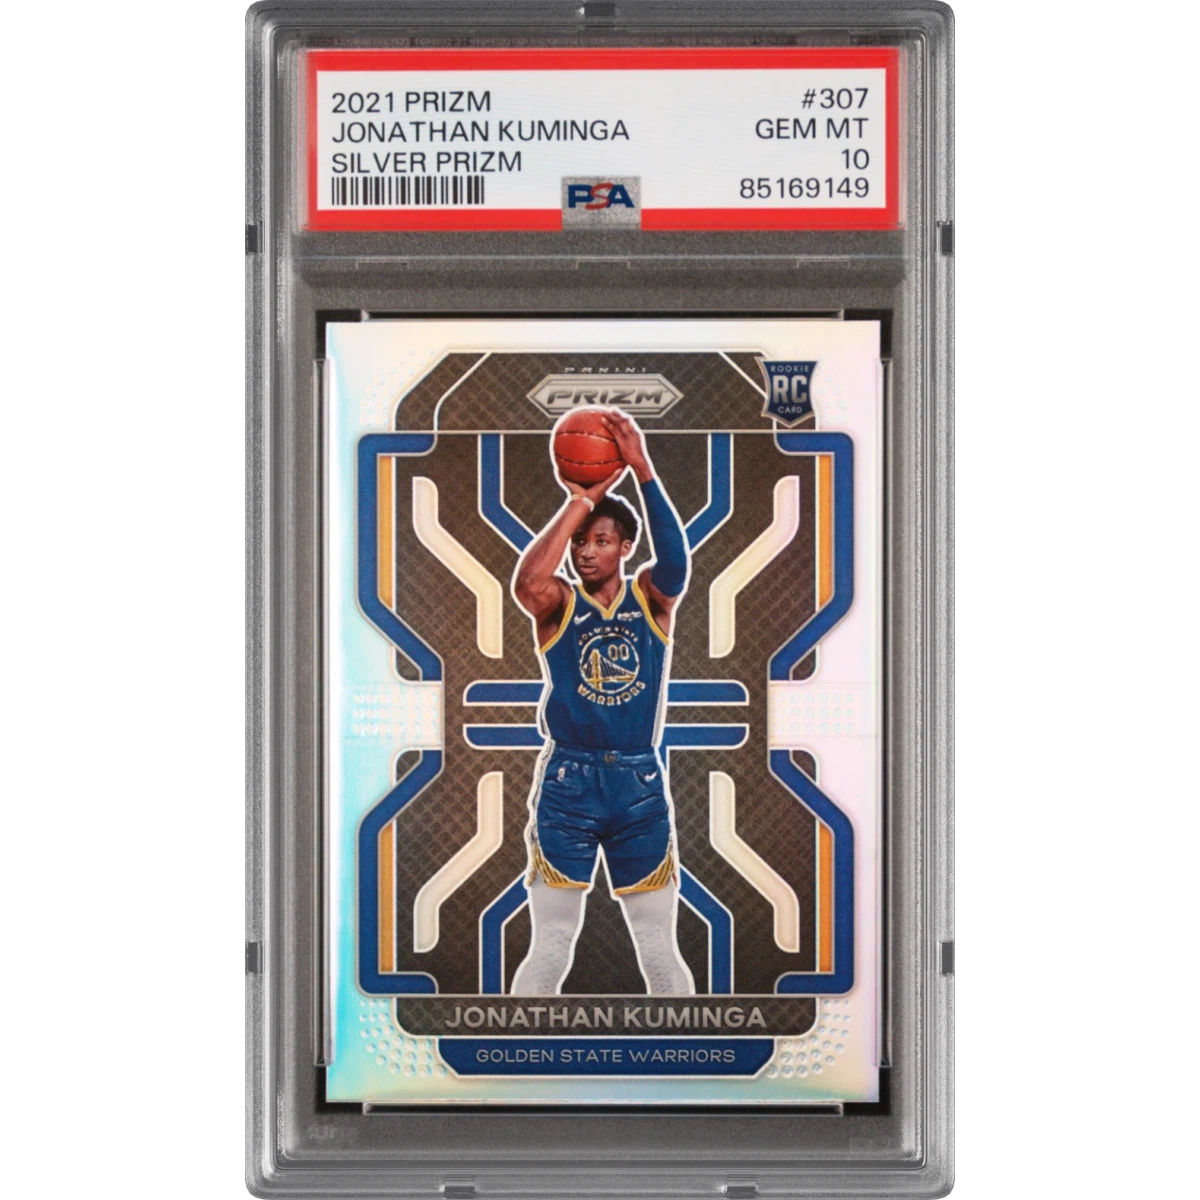 2021 Panini Prizm #307 Jonathan Kuminga - Silver Prizm (PSA 10 GEM MINT)$77.7016h ago
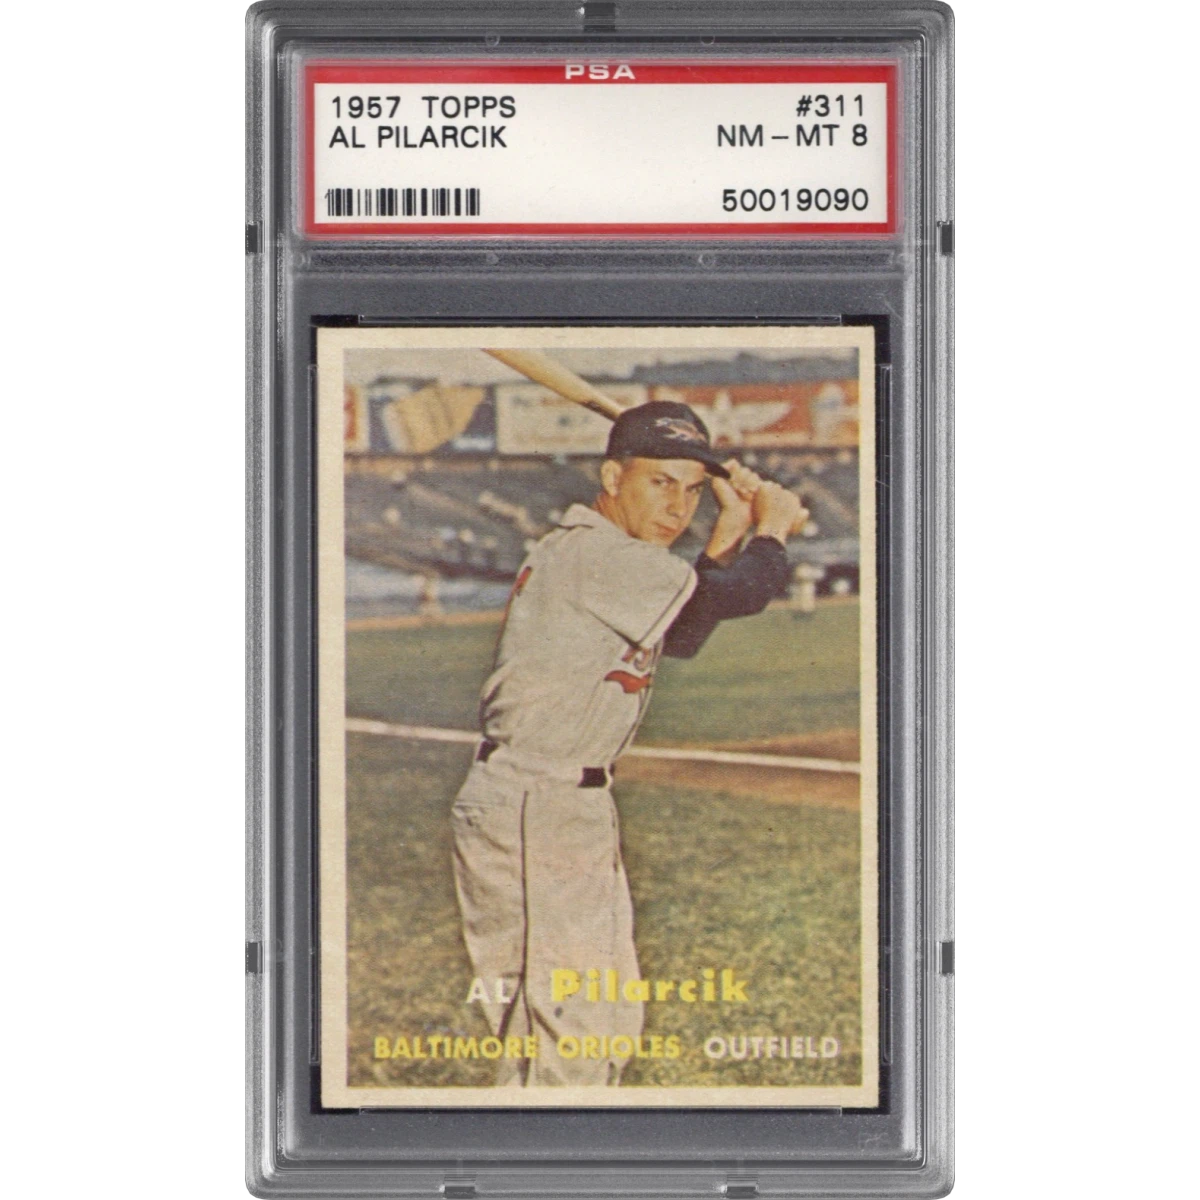 1957 Topps #311 Al Pilarcik (PSA 8 NM-MT)$71.301d ago
- 2025 Panini Prizm #124 Caleb Williams - Pandora (PSA 10 GEM MINT)$227.602d ago
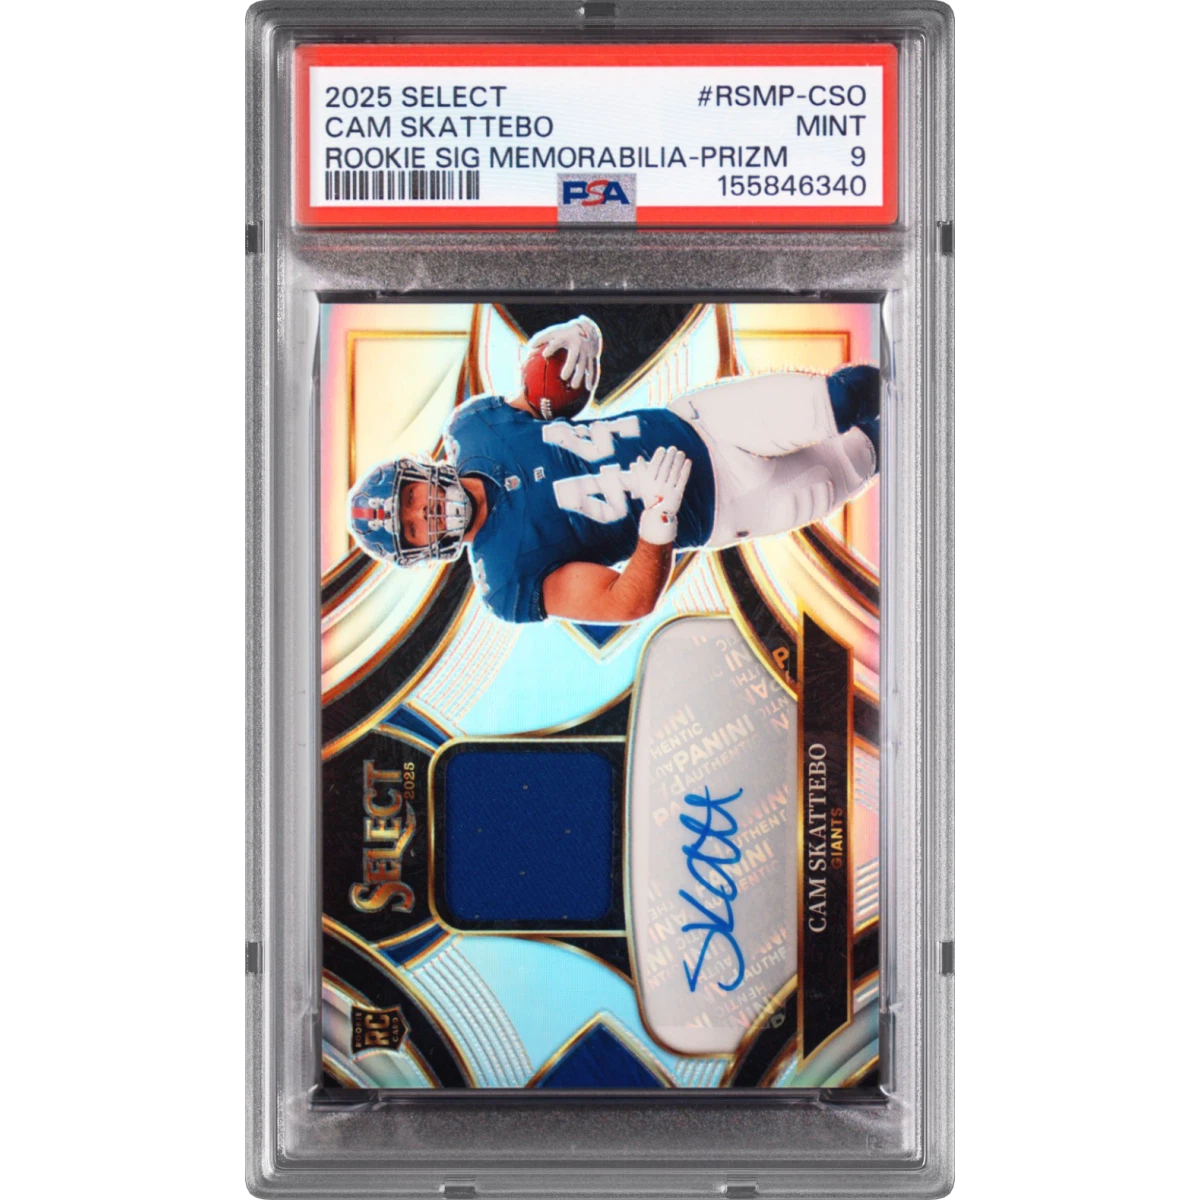 2025 Panini Select Rookie Signature Memorabilia #RSMP-CSO Cam Skattebo - Prizm (PSA 9 MINT)$134.802d ago
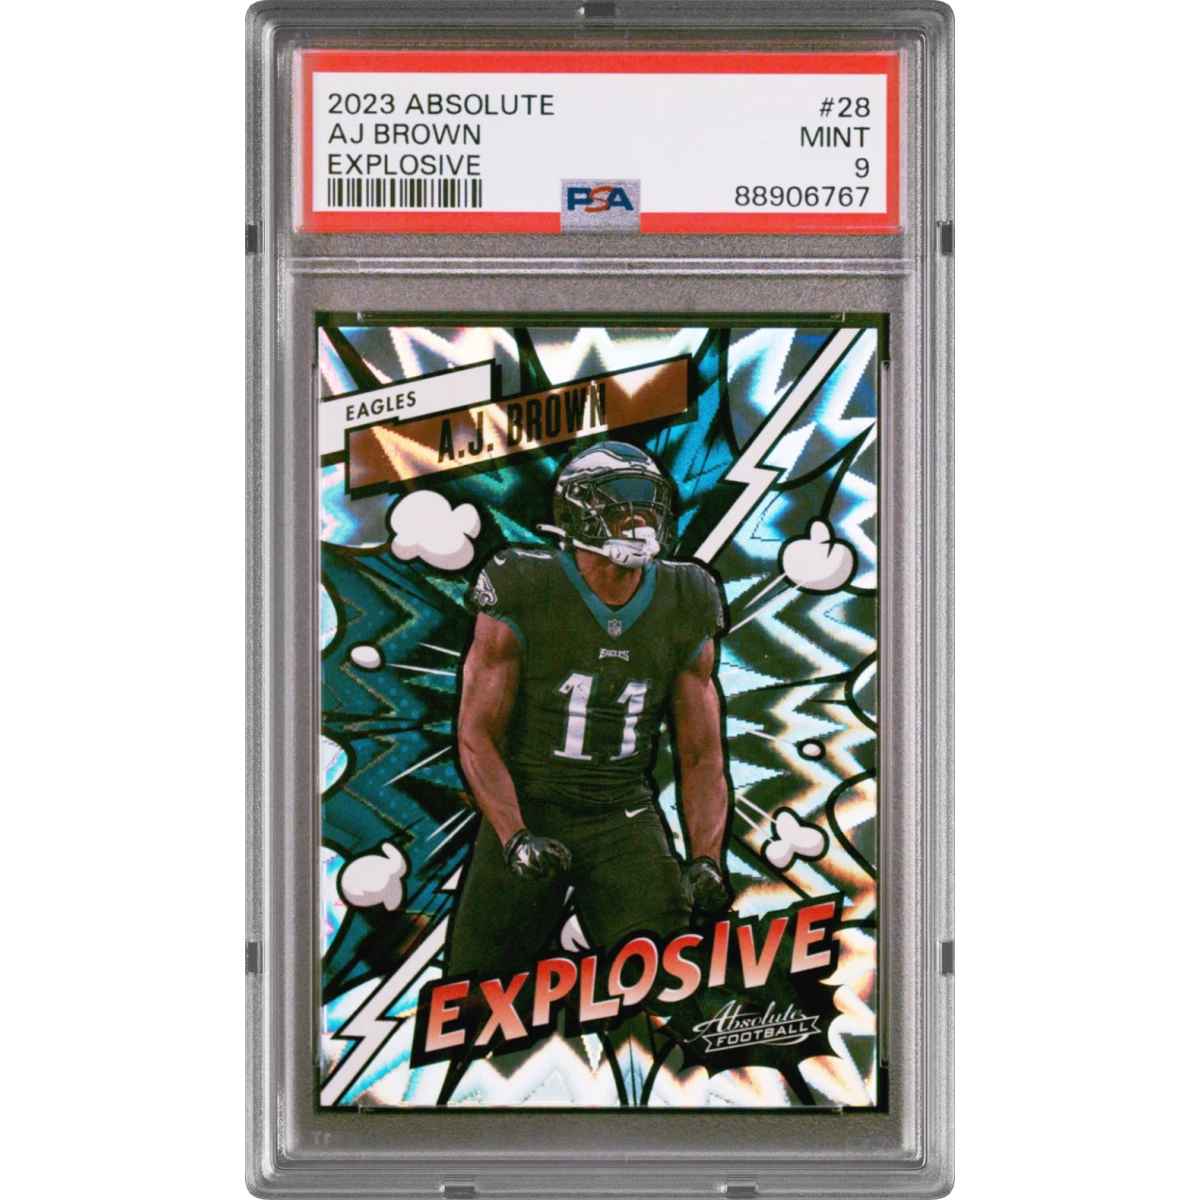 2023 Panini Absolute Explosive #28 AJ Brown (PSA 9 MINT)$147.002d ago
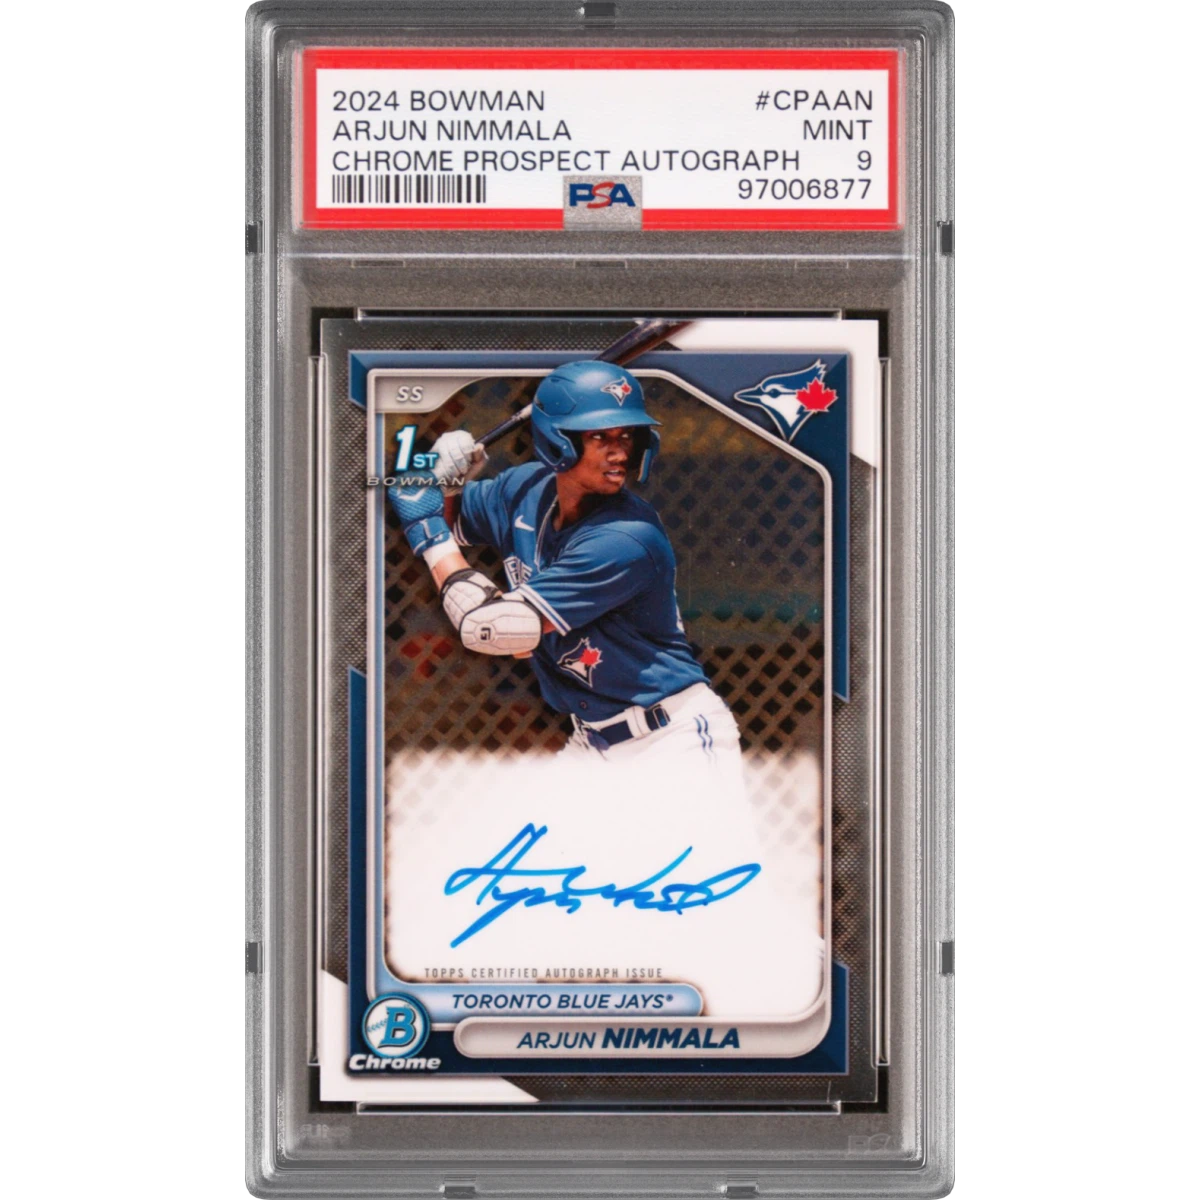 2024 Bowman Chrome Prospect Autographs #CPAAN Arjun Nimmala (PSA 9 MINT)$82.102d ago
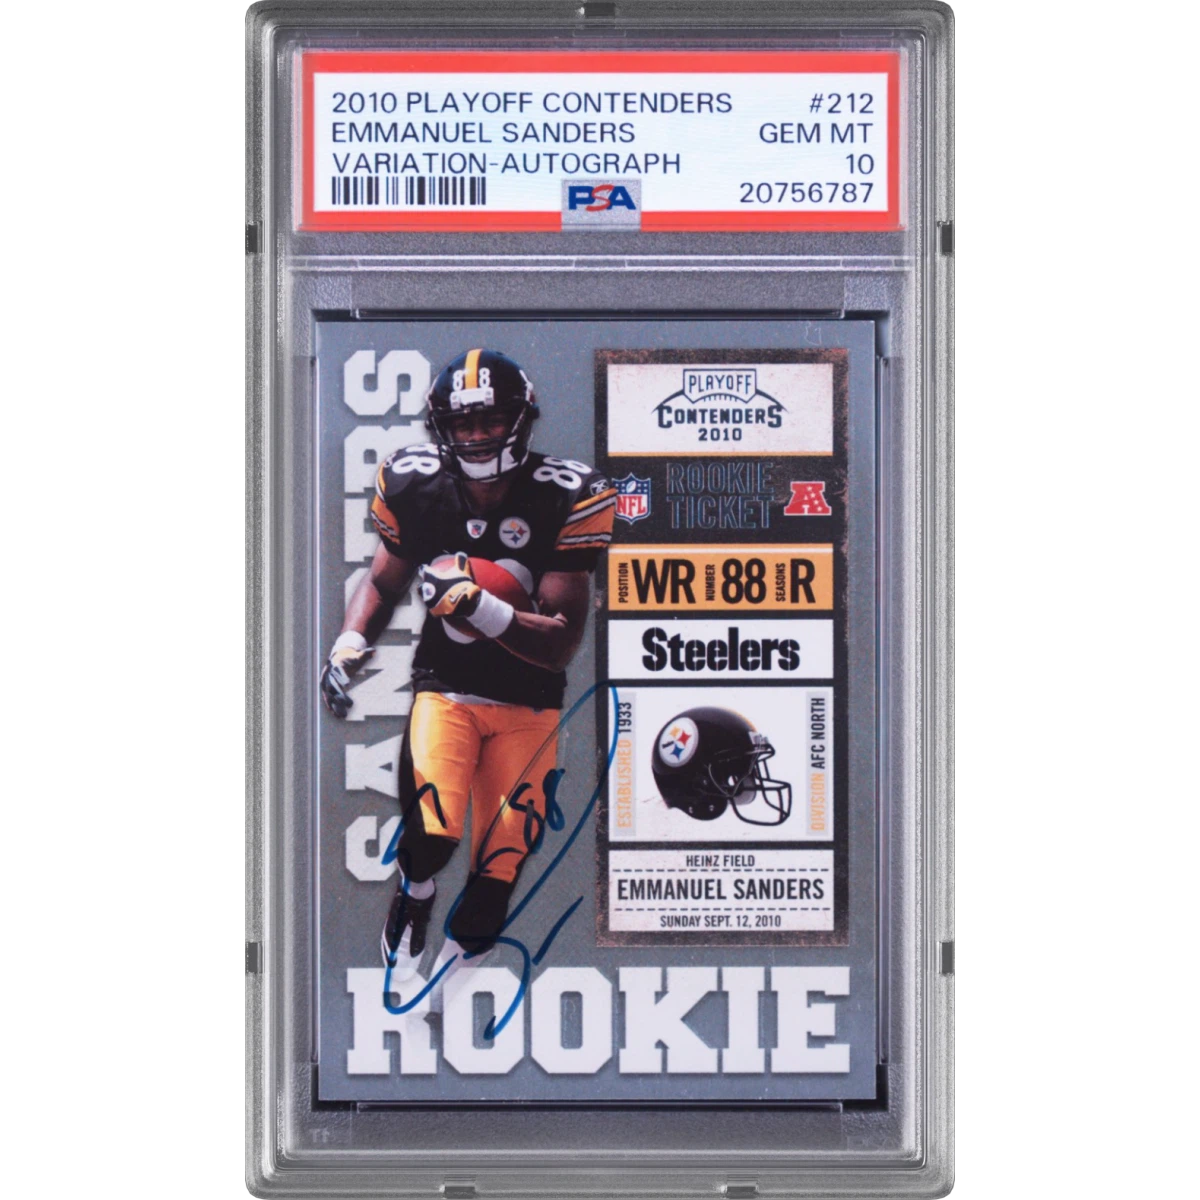 2010 Playoff Contenders #212 Emmanuel Sanders - Variation-Autograph (PSA 10 GEM MINT)$77.302d ago
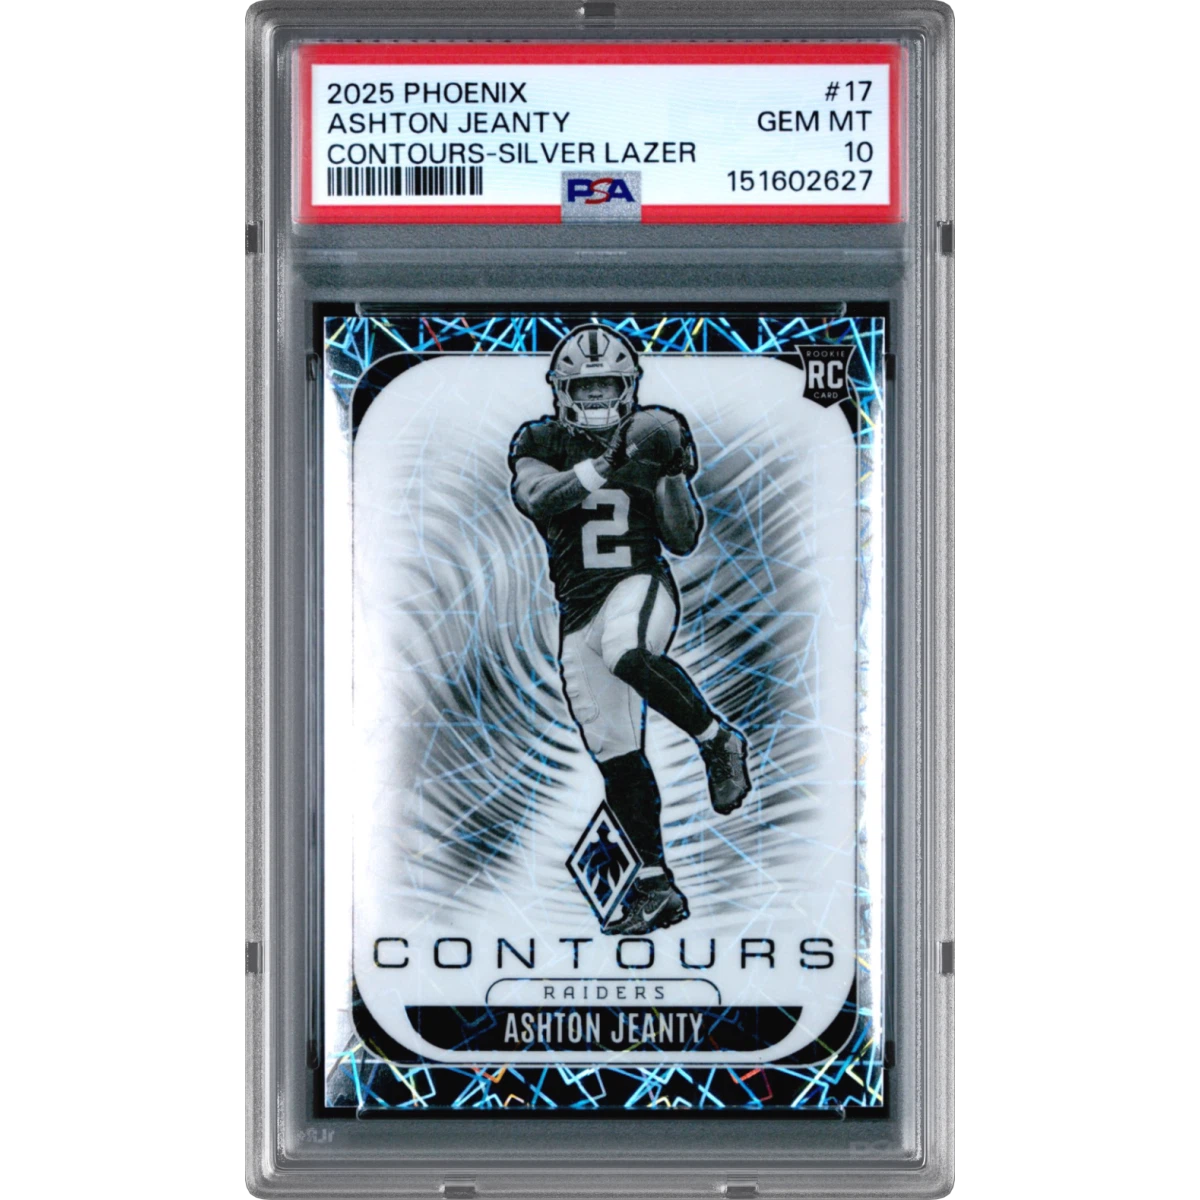 2025 Panini Phoenix Contours #17 Ashton Jeanty - Silver Lazer (PSA 10 GEM MINT)$120.003d ago
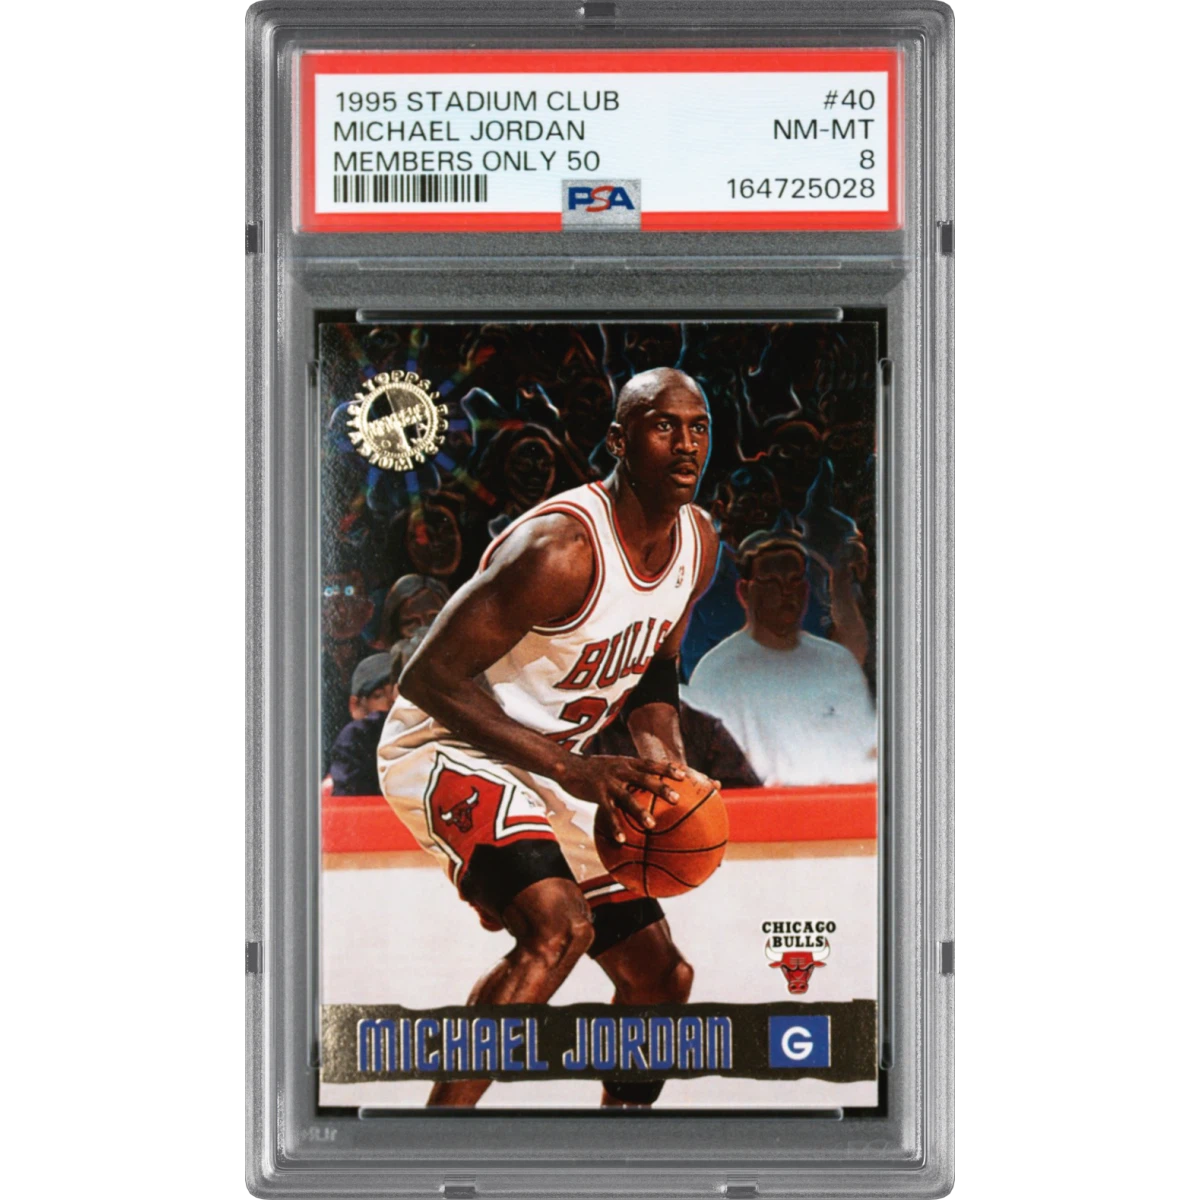 1995 Stadium Club Members Only 50 #40 Michael Jordan (PSA 8 NM-MT)$75.203d ago
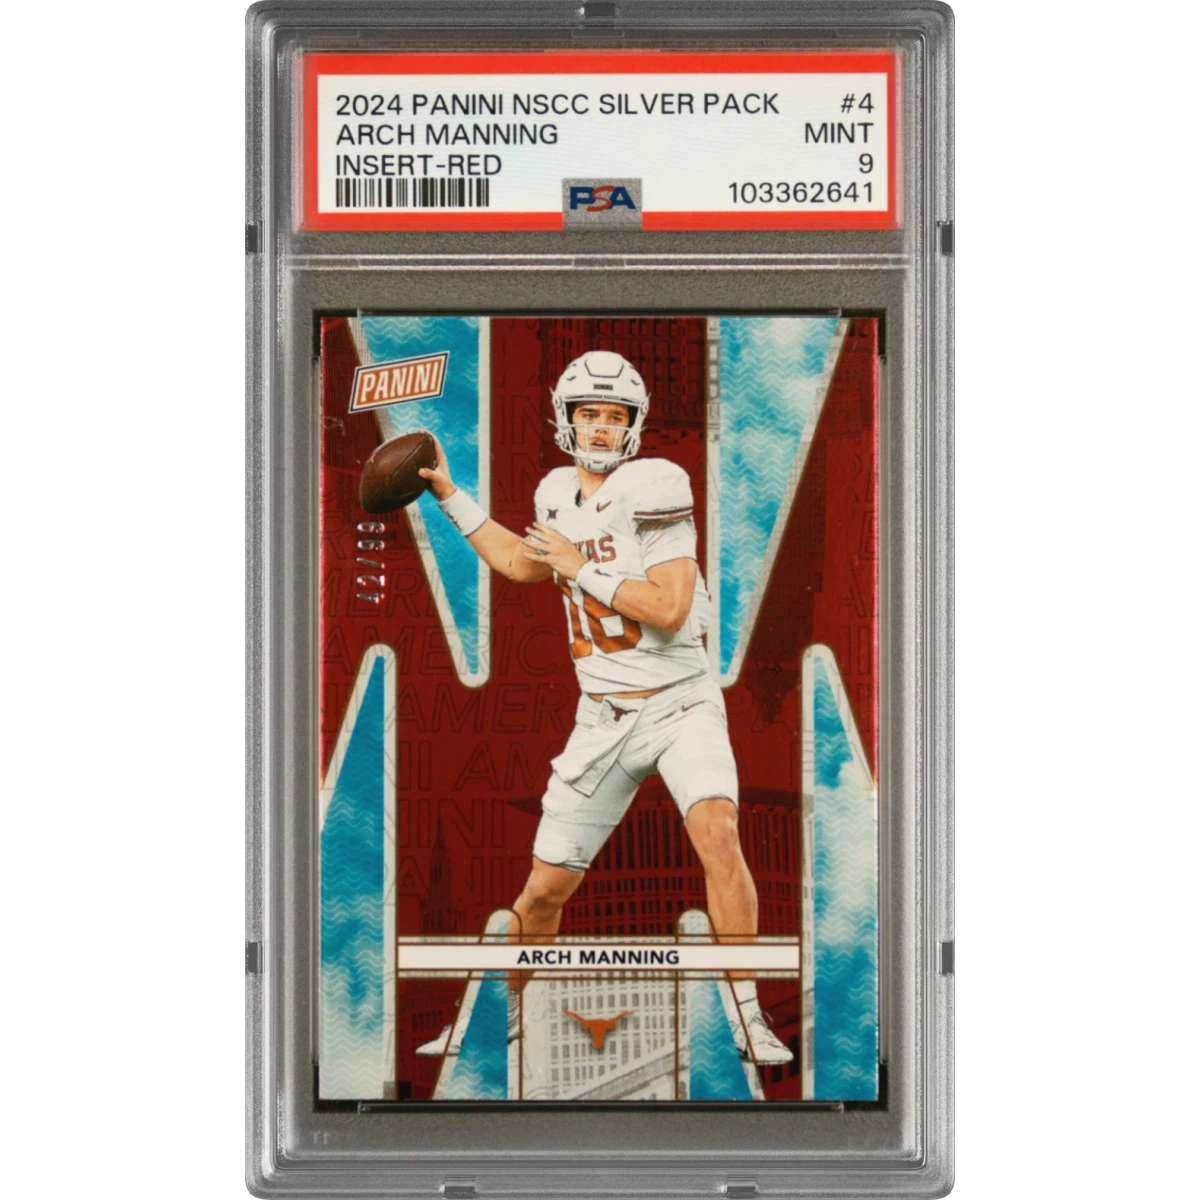 2024 Panini National Sports Collectors Convention Insert #4 Arch Manning - Red (PSA 9 MINT)$127.003d ago
- 2024 Panini Obsidian Supernova #3 LeBron James - Electric Etch Pink Flood (PSA 10 GEM MINT)$302.003d ago
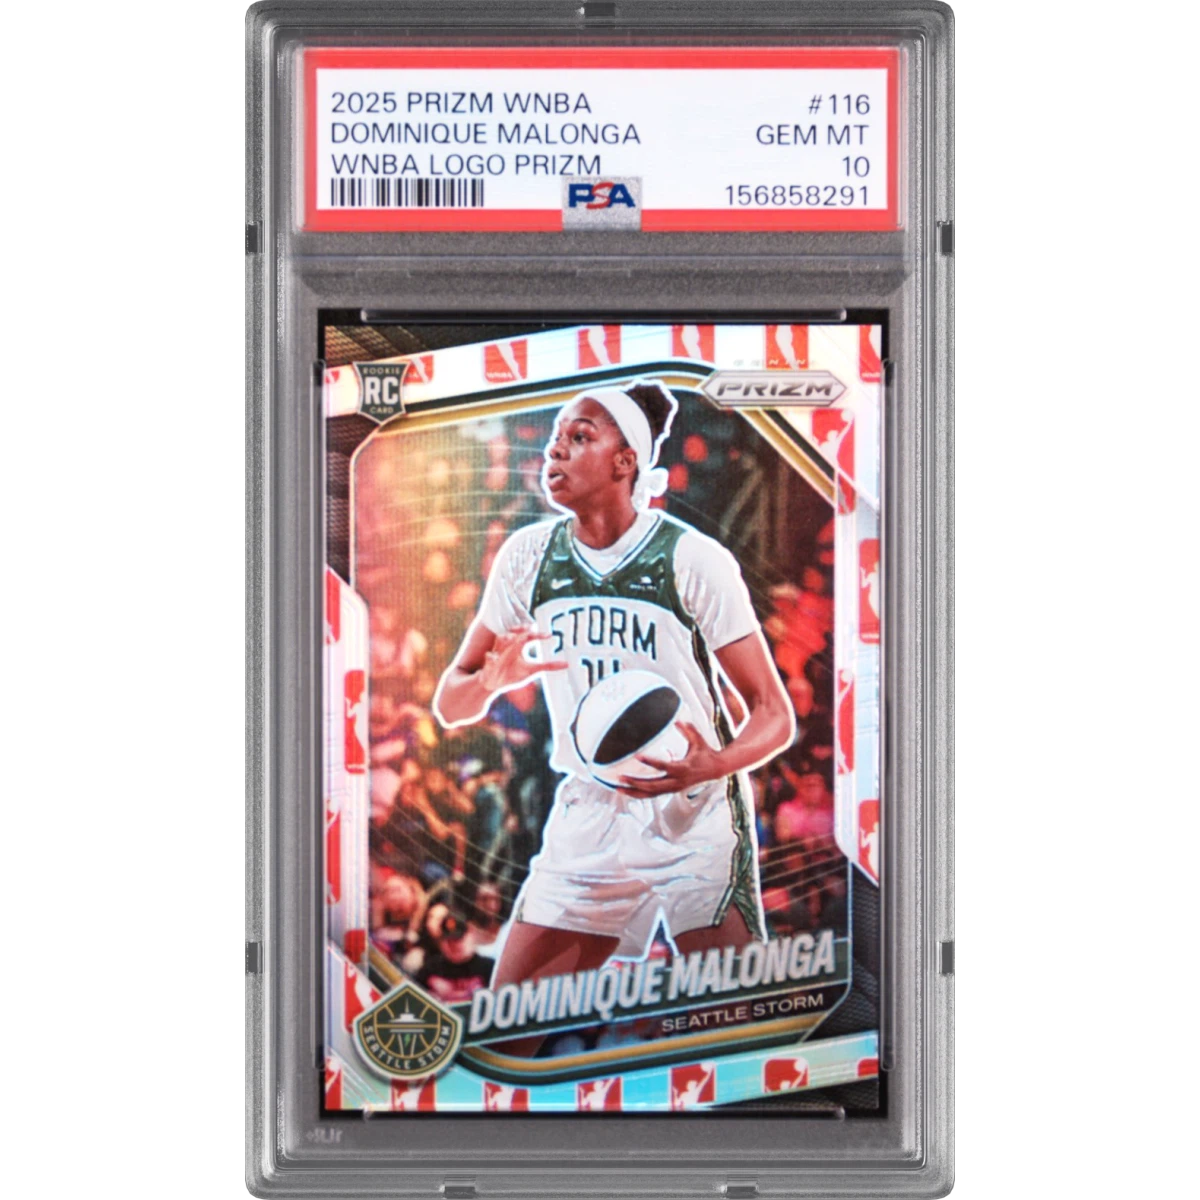 2025 Panini Prizm WNBA #116 Dominique Malonga - WNBA Logo Prizm (PSA 10 GEM MINT)$90.503d ago
- 1965 Topps #477 Cardinals Rookies - Fritz Ackley/Steve Carlton (PSA 4.5 VG-EX+)$205.003d ago
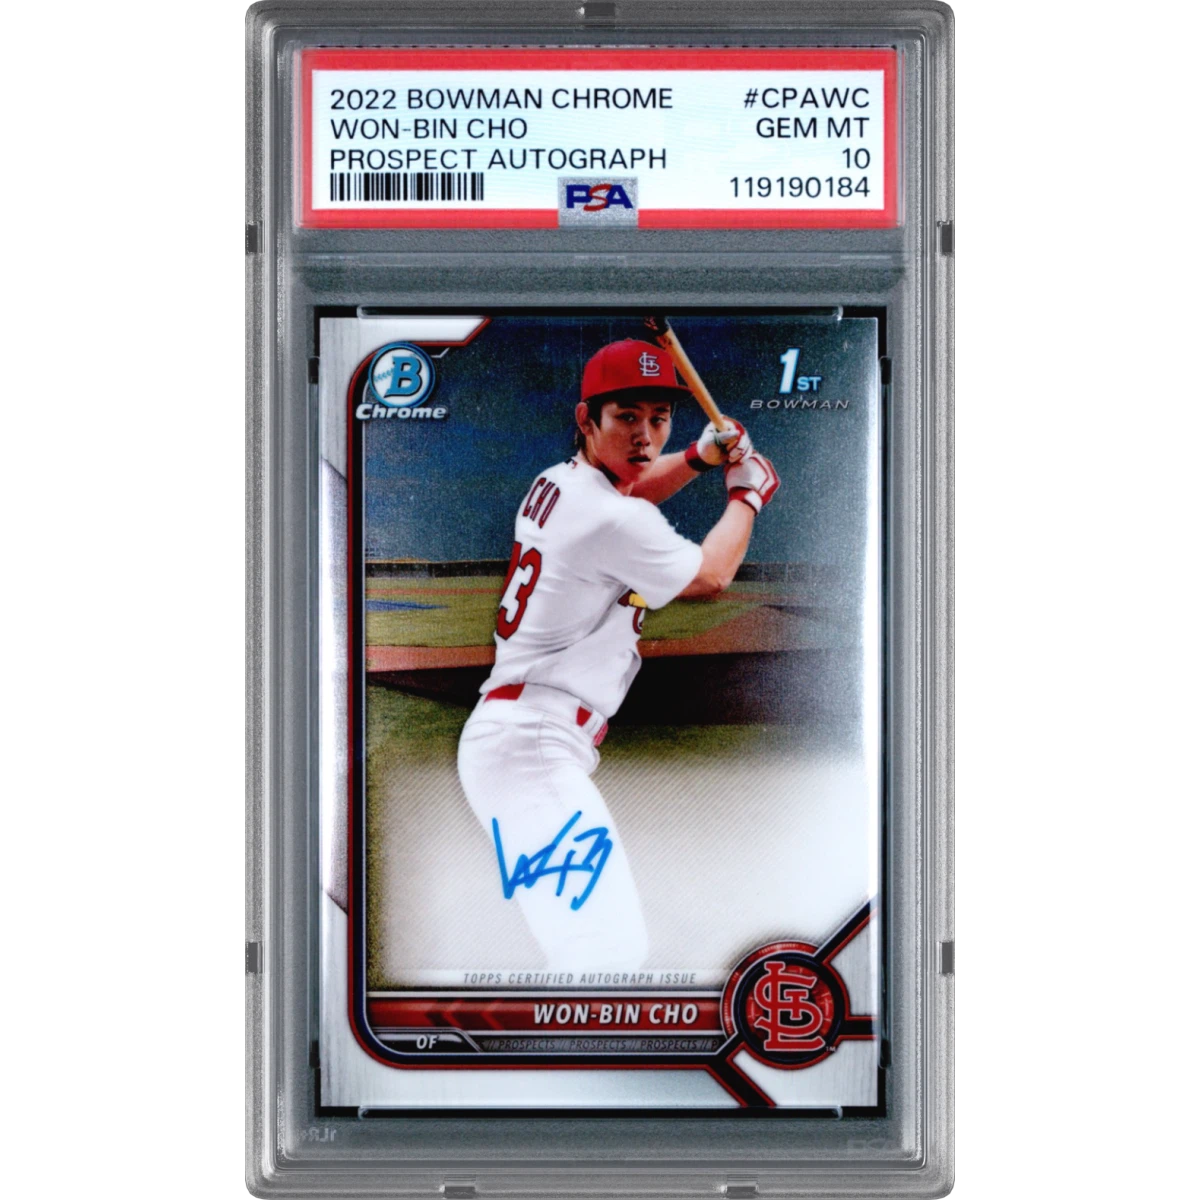 2022 Bowman Chrome Prospect Autographs #CPAWC Won-Bin Cho (PSA 10 GEM MINT)$75.204d ago
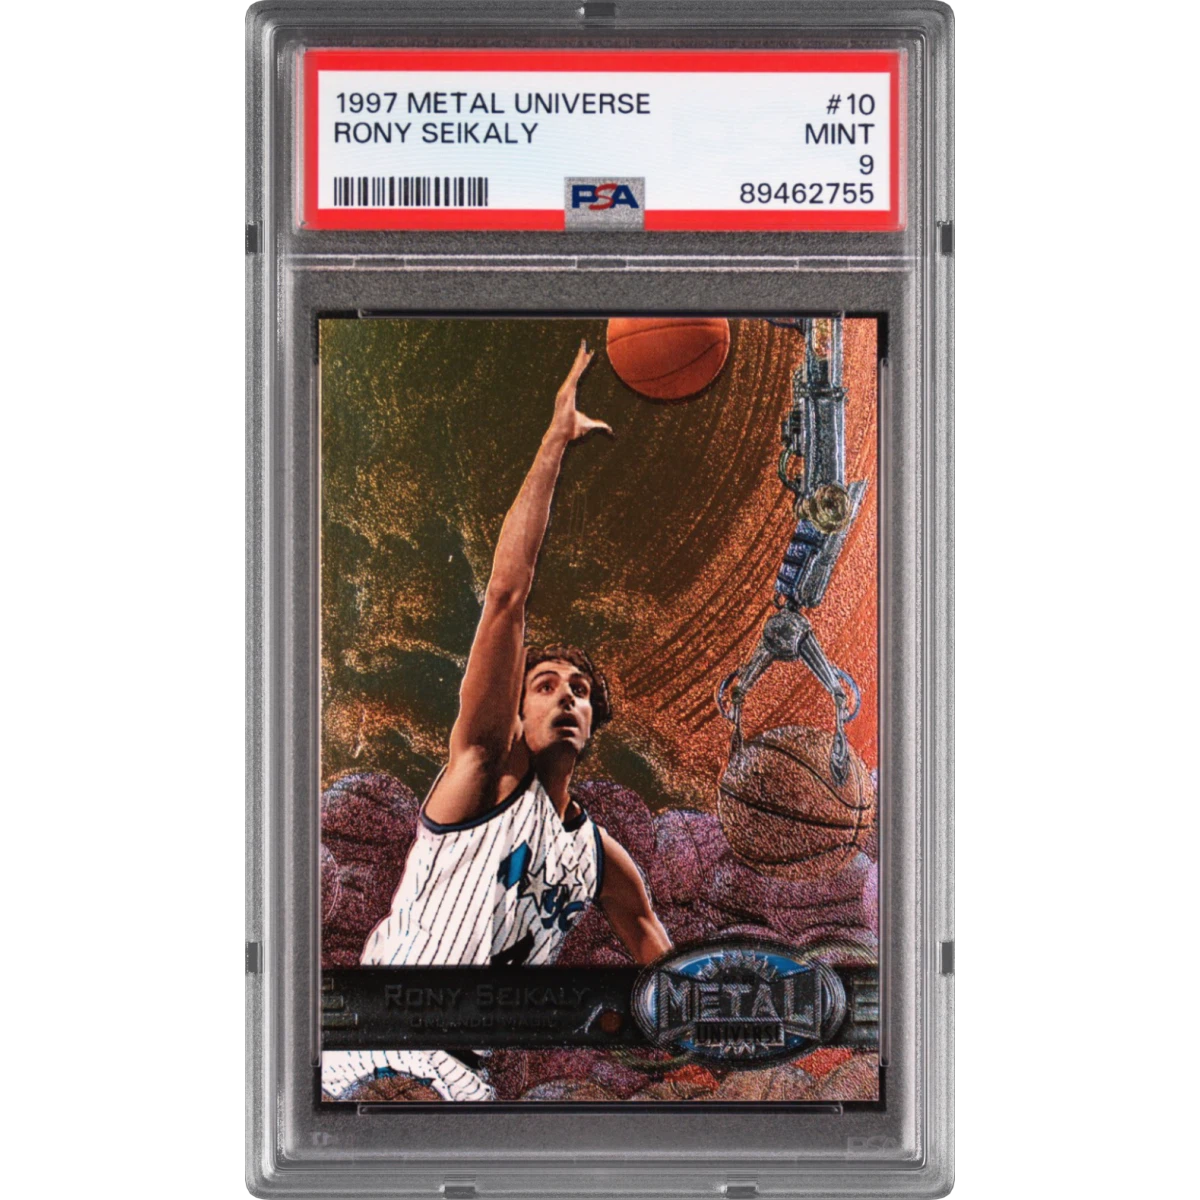 1997 Metal Universe #10 Rony Seikaly (PSA 9 MINT)$71.204d ago
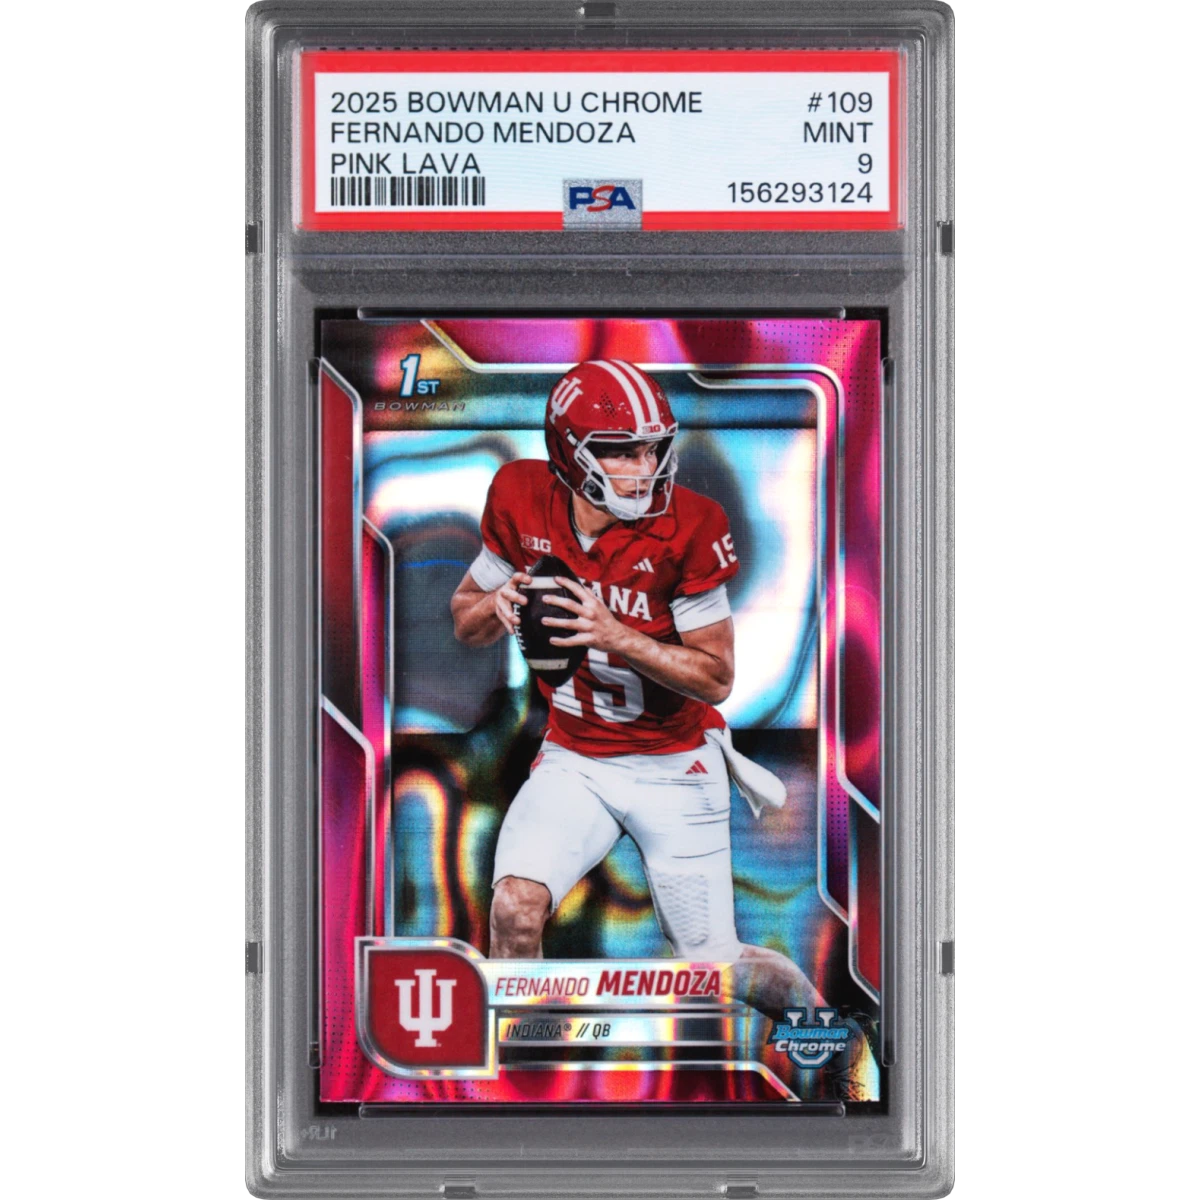 2025 Bowman University Chrome #109 Fernando Mendoza - Pink Lava (PSA 9 MINT)$95.304d ago
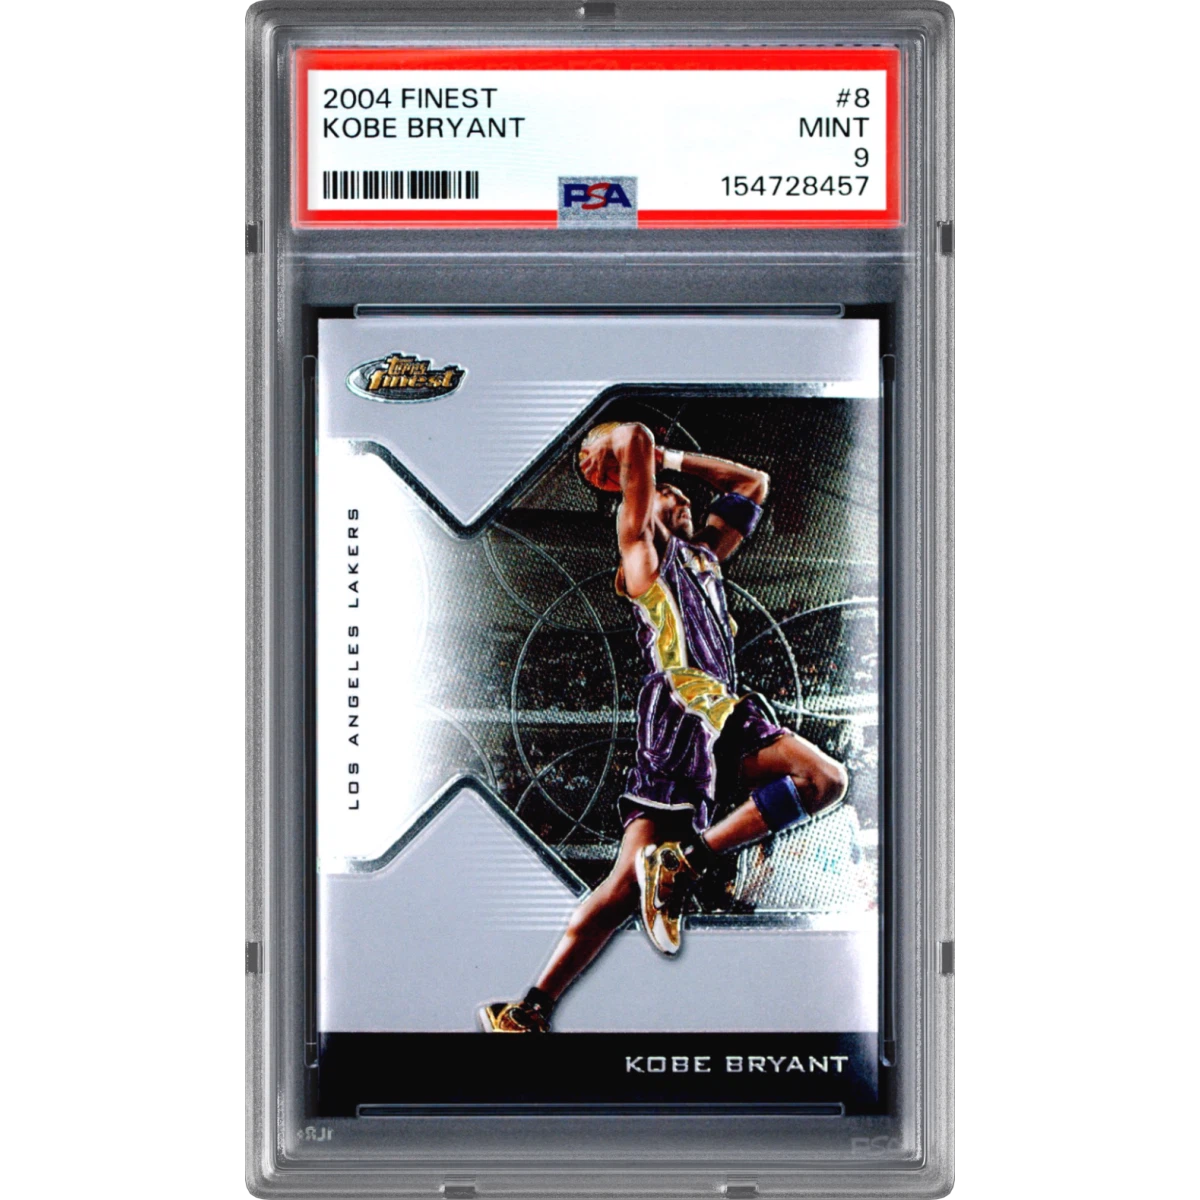 2004 Finest #8 Kobe Bryant (PSA 9 MINT)$75.805d ago
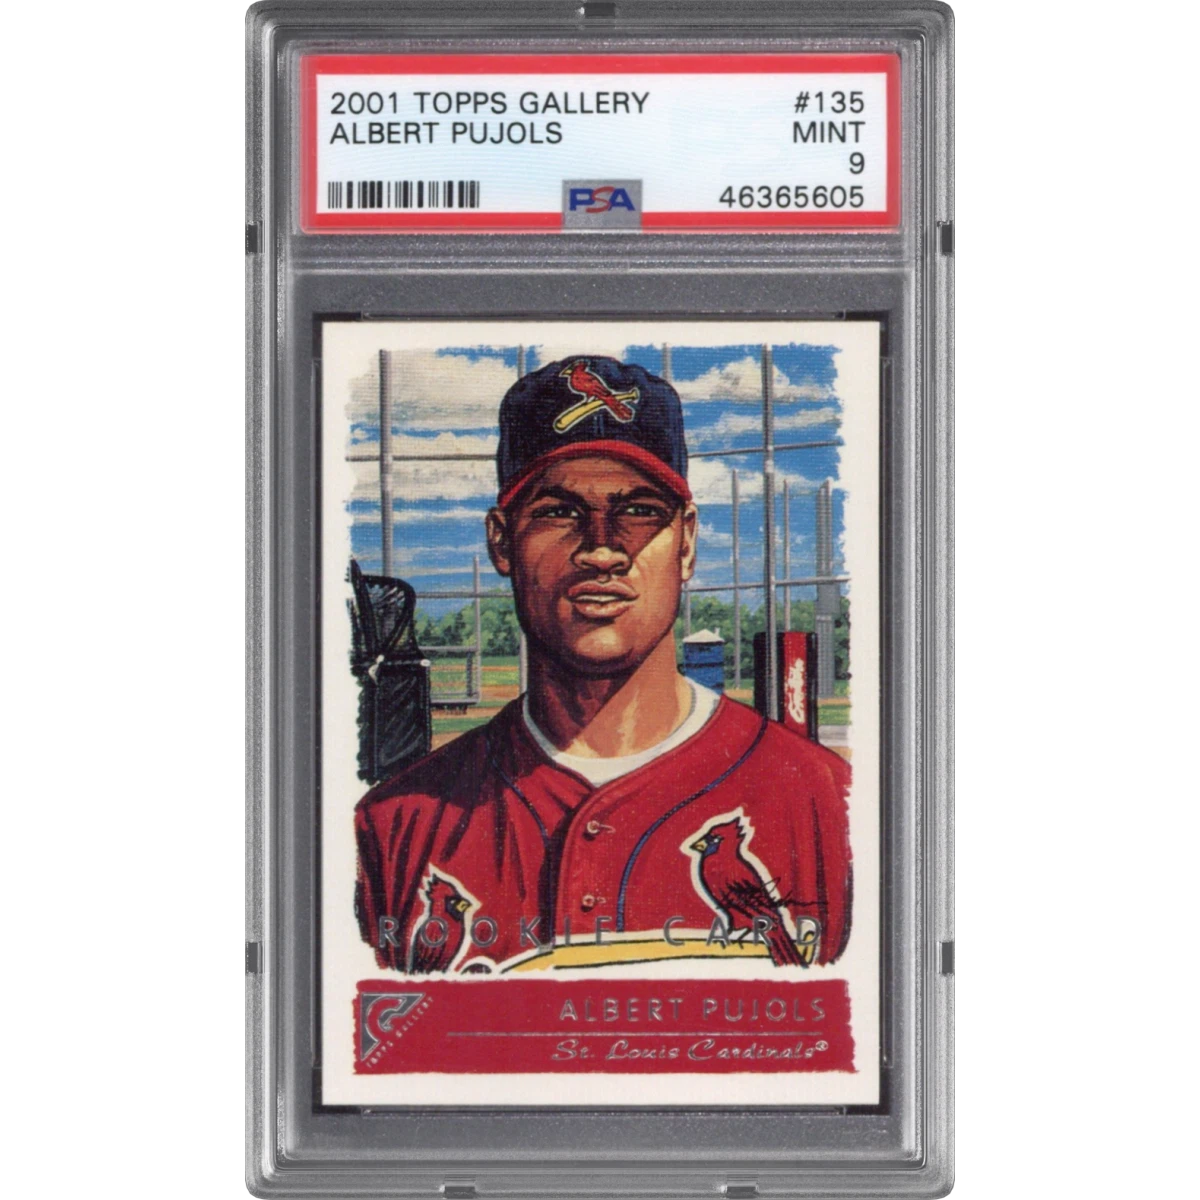 2001 Topps Gallery #135 Albert Pujols (PSA 9 MINT)$72.805d ago
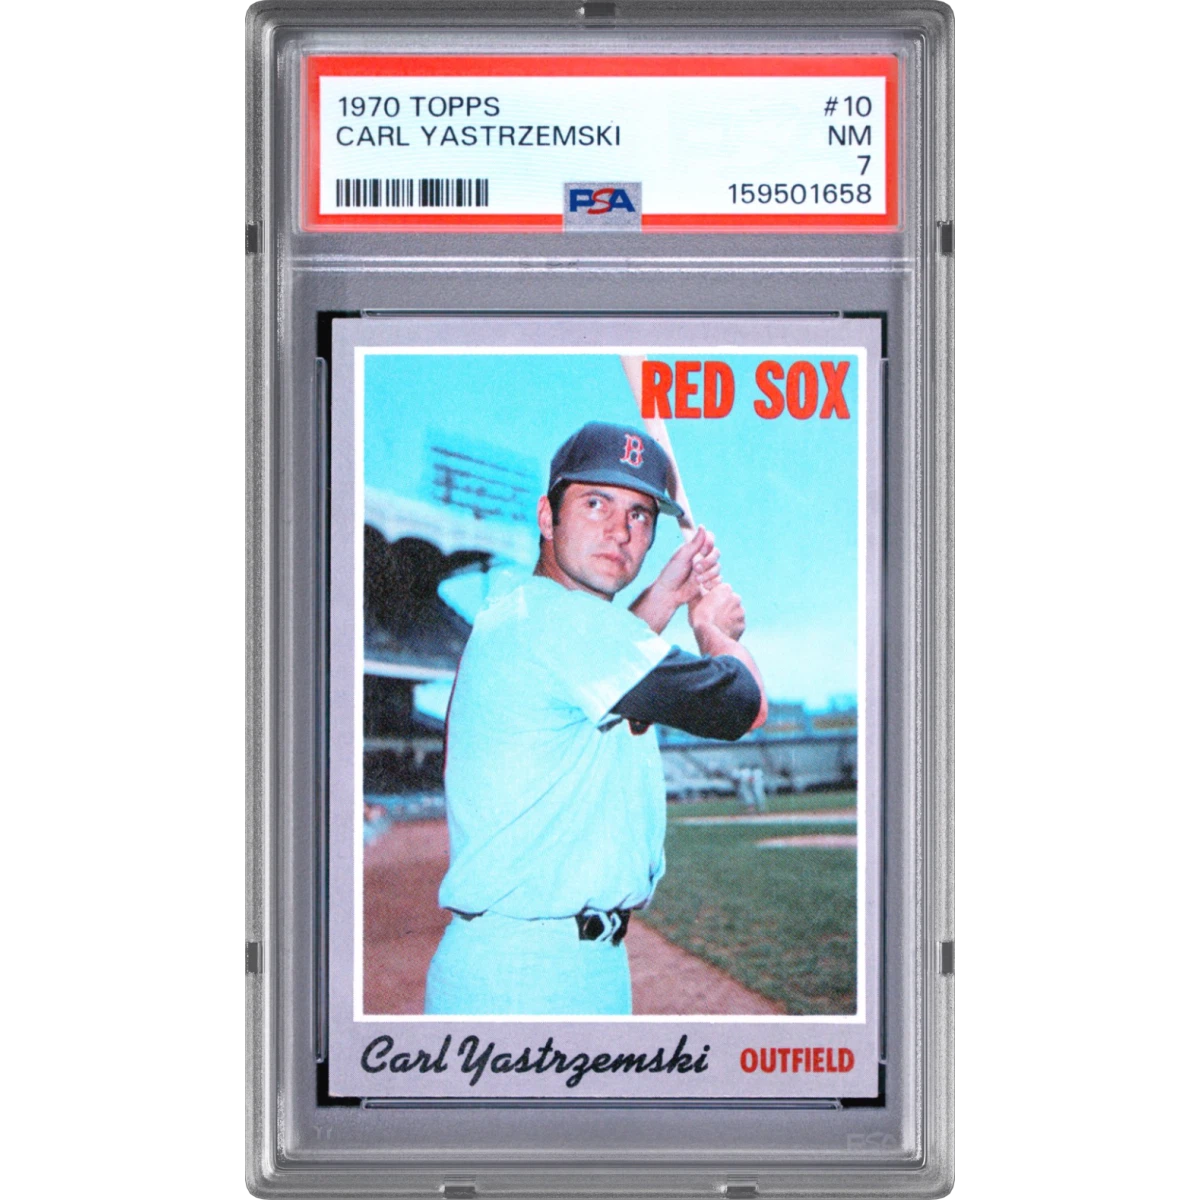 1970 Topps #10 Carl Yastrzemski (PSA 7 NM)$93.905d ago
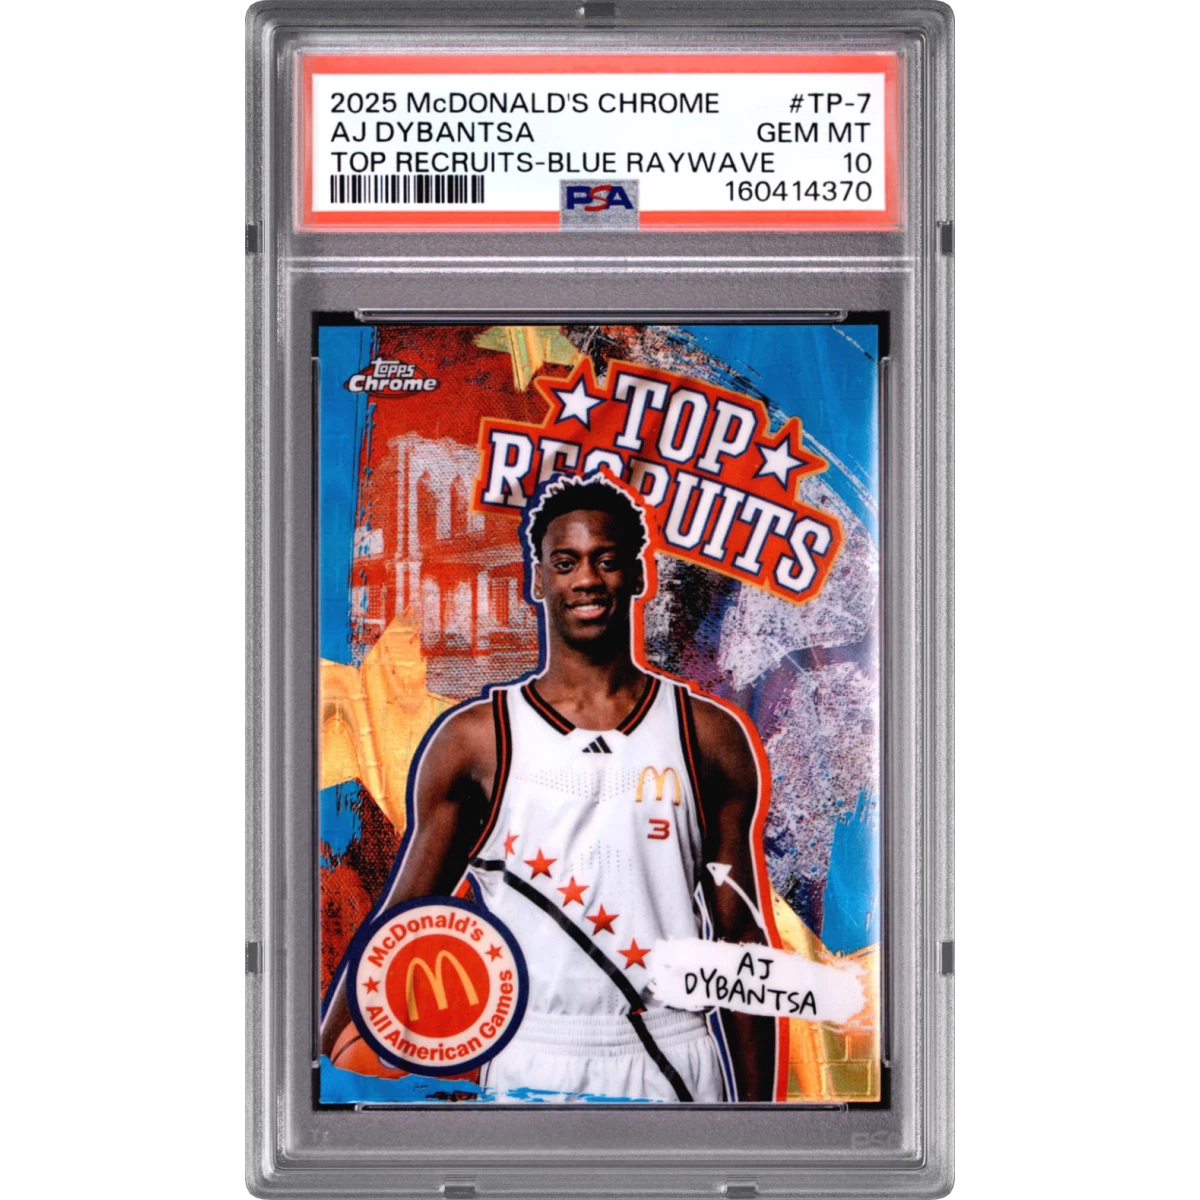 2025 Topps Chrome McDonald's All American Top Recruits #7 AJ Dybantsa - Blue Raywave (PSA 10 GEM MINT)$84.506d ago
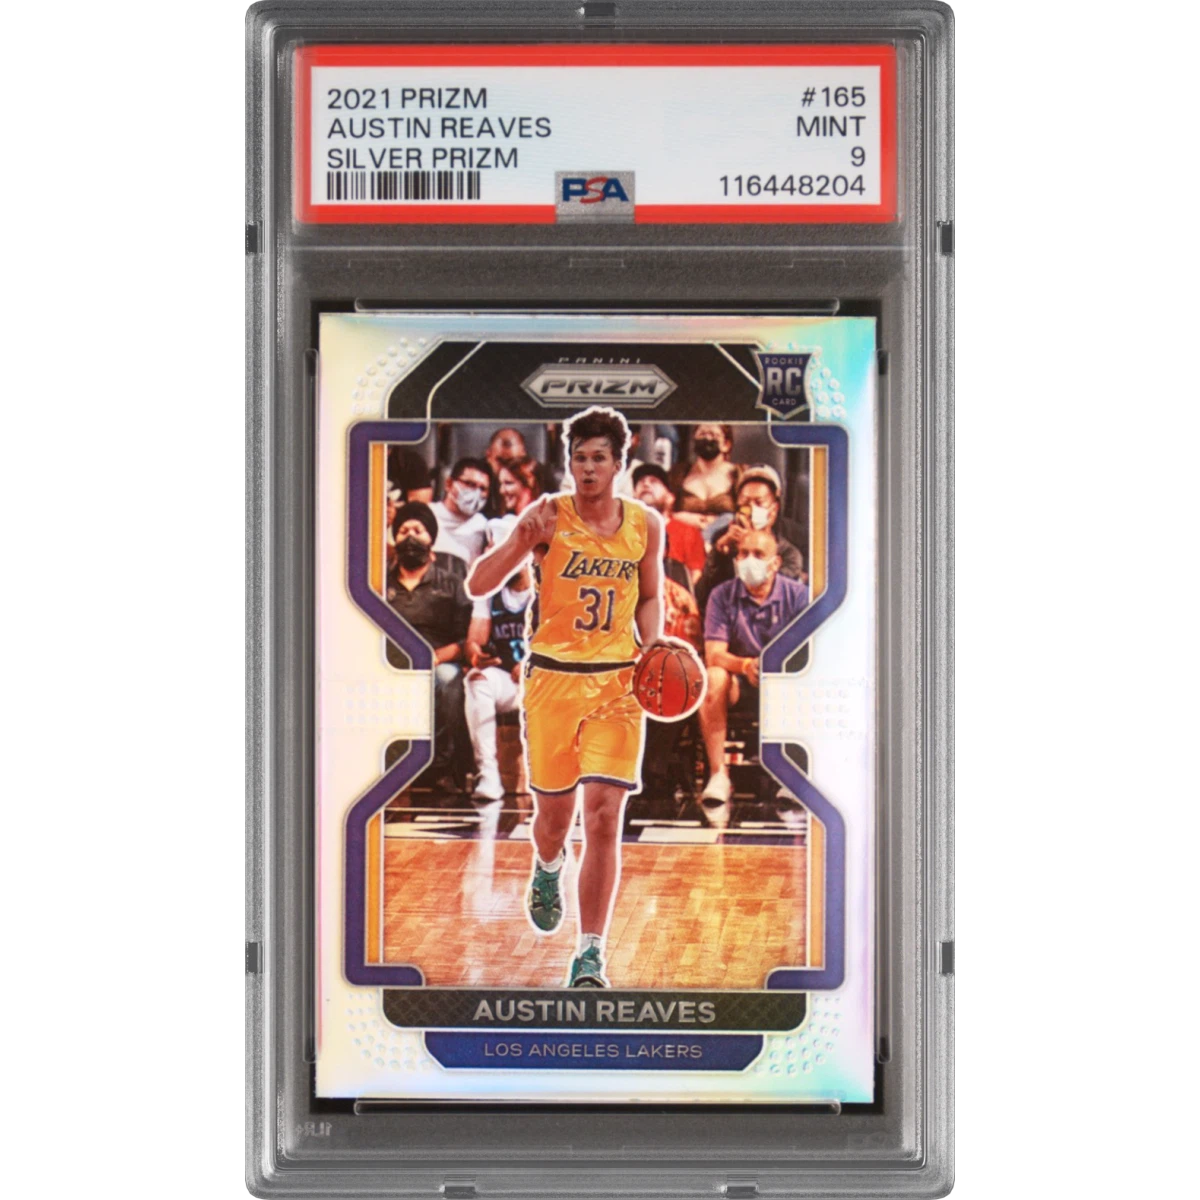 2021 Panini Prizm #165 Austin Reaves - Silver Prizm (PSA 9 MINT)$72.906d ago
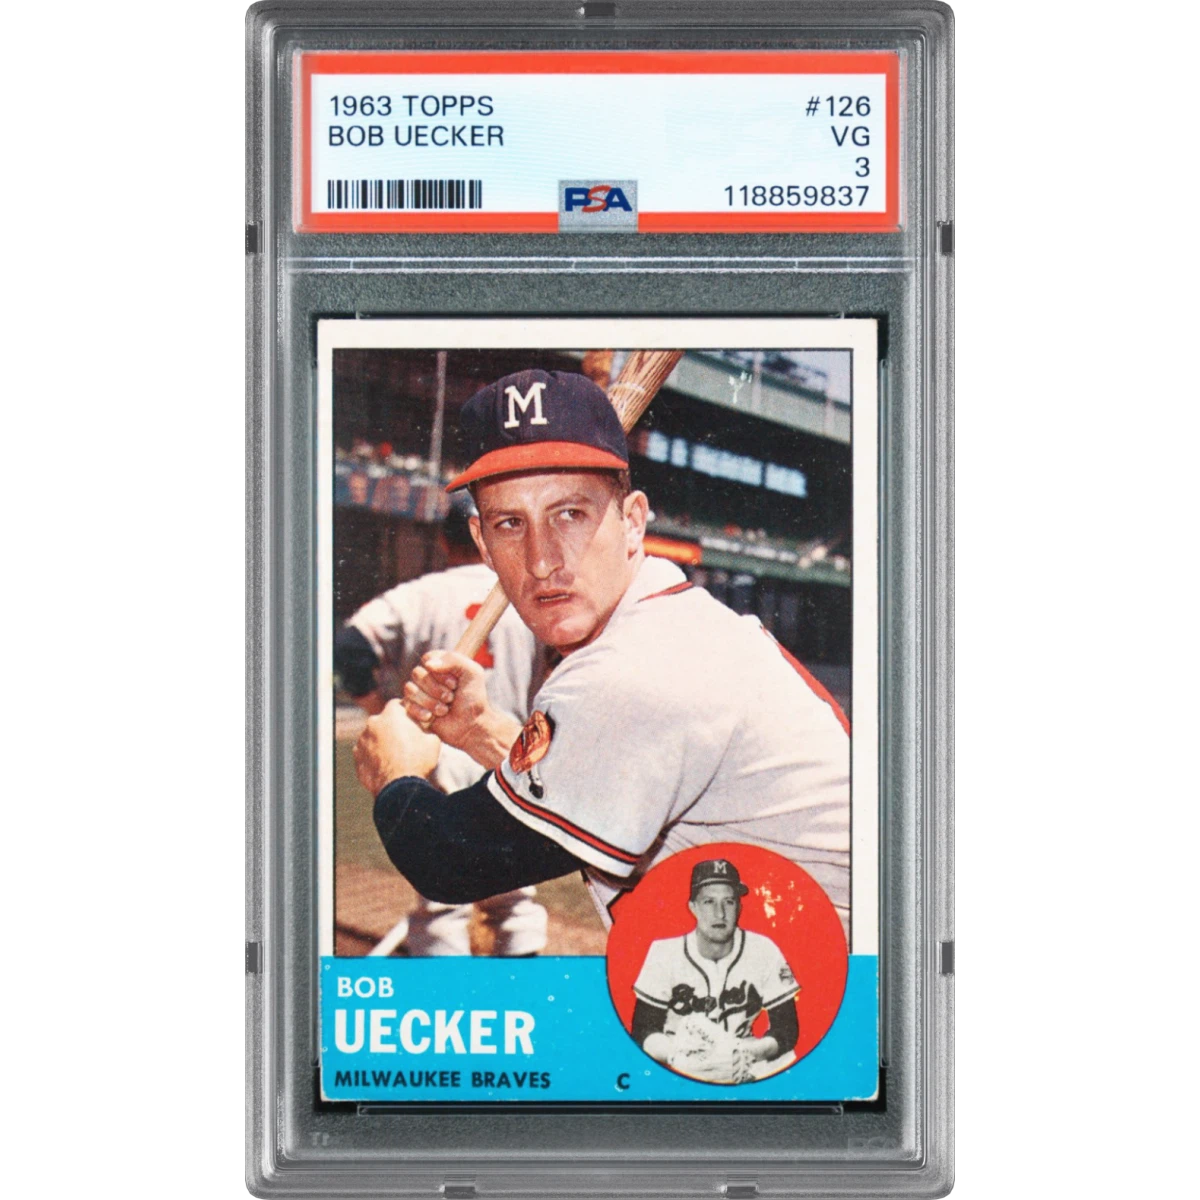 1963 Topps #126 Bob Uecker (PSA 3 VG)$89.006d ago
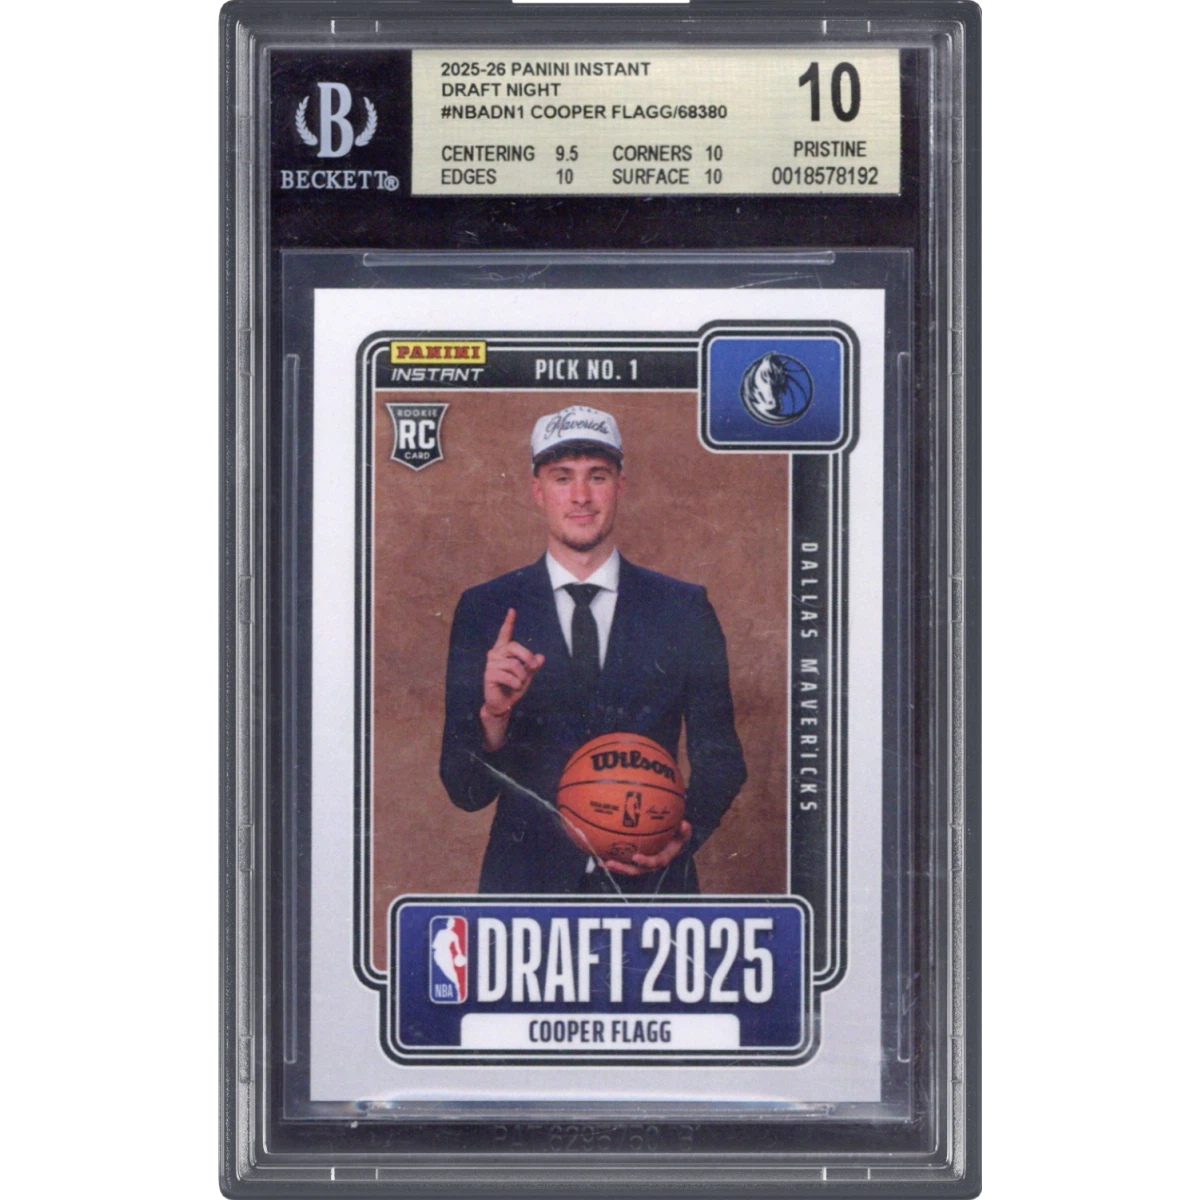 2025 Panini Instant NBA Draft Night #1 Cooper Flagg (BGS 10 PRISTINE)$83.507d ago
- Free shows the latest 25 pulls. Pro unlocks the full history + CSV export →
Compare Sports Master Pack with other Basketball packs
Same math, same methodology — cash-out ratios after each pack's own buyback, so the comparison is apples to apples.
- Sports Cosmic PackEV $9,008SET PACK PRICE
- Basketball Mythic Pack0.789x cash-out · EV $4,665 · hit rate 23.5%HOUSE EDGE
- Basketball Legend Pack1.030x cash-out · EV $3,042 · hit rate 20.0%+EV
- Basketball Diamond Pack0.745x cash-out · EV $881 · hit rate 20.0%HOUSE EDGE
- Sports Ghost Gold+EV $769SET PACK PRICE
- Sports InfernoEV $708SET PACK PRICE
Understand these numbers
Every figure on this page — EV, EV ratio, hit rate, dilution — is defined once and computed the same way for every pack.