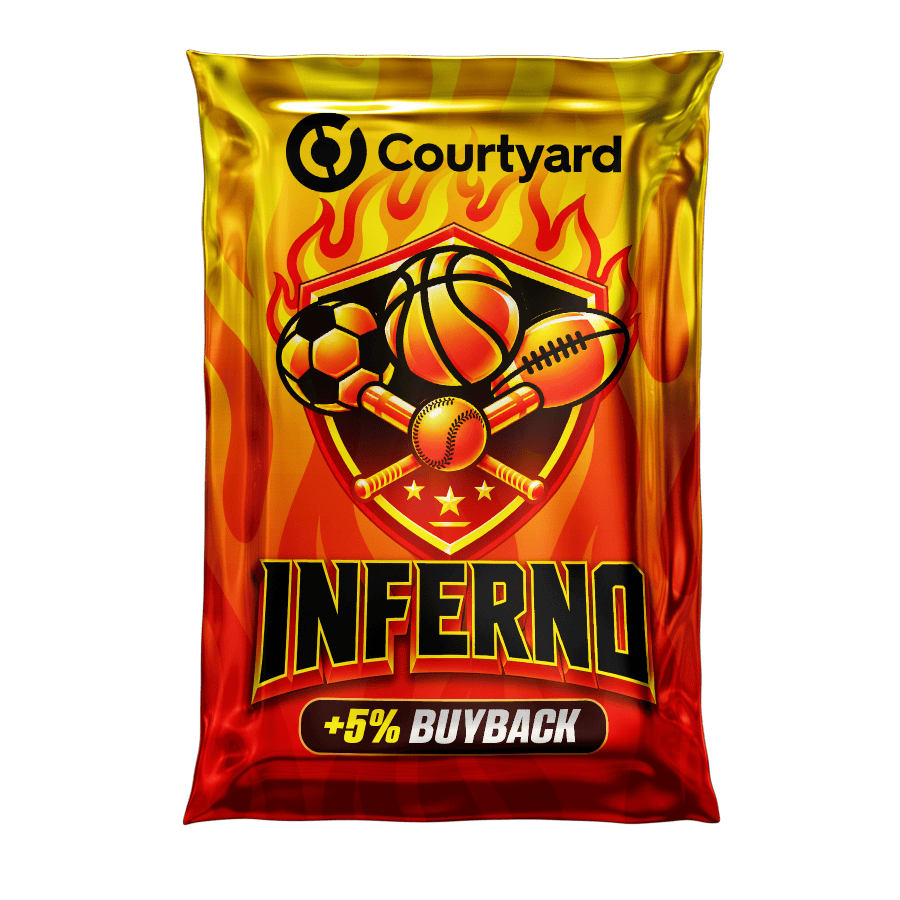
Basketball
Sports Inferno
Sports Inferno is a Courtyard Basketball mystery pack with a calibrated expected value of $708.47 and a typical (median) pull of $589.00 across 32 indexed pulls. Its pack price is not yet confirmed, so the EV ratio, hit rate, and Rip Advisor verdict are pending.
Calibrated EV
$708
- Calibrated EV
- $708
- Cash-out EV
- $635
- Pack price
- Unknown
- Typical pull
- $589
- Hit rate
- —
- Lifetime EV
- $705
- Pulls indexed
- 32
- Last pull
- 47d ago
01 / Rip Advisor
Is Sports Inferno worth it right now?
- No pack price on record, so no net or ROI figure can be computed.
Verdict is computed transparently from indexed pulls: cash-out ROI, median pull, 7-day trend, hit rate, and sample size. Redemption shipping (typically $16+) is not included — cards worth less than a few times the shipping cost are usually better instant-sold than shipped. Not financial advice.
02 / Pool signals
What's happening in the Sports Inferno pool
No price set — pool economics can’t be computed.
No price set — pool economics can’t be computed.
Pro adds the Pool Health score and chase-removal impact.
Not observable: packs remaining, value remaining, and which chases are still in the pool — Courtyard publishes a pull feed, not inventory. We label those unavailable rather than estimate them. Everything above is computed from indexed pulls and EV snapshots; thin or stale data pulls the score toward neutral. Formula
Chase tracker
No pack price set, so a chase tier cannot be anchored.
Signal lifetime
SIGNAL Awaiting new data · 47 days agoNo pulls indexed recently, so this read cannot refresh. Treat it as a snapshot of the past.
- Newest pull
- 47 days
- observed
- Pull rate
- none
- observed
- Pulls, 7d
- 0
- observed
- Half-life
- Pro
Aged, not predicted. Half-life counts how fast new evidence arrives, measured from real pull timestamps — it is not a forecast of where EV is heading. We publish no EV-drift half-life because our snapshot history is still too short for a regression to mean anything. The seeded placeholder points this note used to warn about have been flagged in the database and excluded from every chart, trend and score, so what you see plotted is observed data. Note the headline EV is decay-weighted, so it reacts to new pulls sooner than this whole-sample horizon implies. Methodology
03 / Contents
What has come out of Sports Inferno
By era
Cards seen range from 1961 to 2025.
- Current (2020+)47%$586 avg
- Modern (2010-2019)25%$872 avg
- Vintage (pre-2000)22%$824 avg
- Retro (2000-2009)6%$503 avg
Most common sets
Sets these pulls came from.
- Topps19%$812 avg
- Fleer Sticker6%$682 avg
- Panini Donruss Optic Downtown6%$542 avg
- Panini Prizm6%$624 avg
- Topps Chrome6%$440 avg
- Upper Deck6%$779 avg
- Panini Donruss3%$422 avg
- Panini La Liga Megacracks3%$389 avg
Cards seen most often
Named on 97% of readable pulls. The rest do not print a card number, and without one the card cannot be told apart from the set name.
- Aaron Judge6%$1,528 avg
- Kobe Bryant6%$483 avg
- Lamine Yamal6%$700 avg
- Shohei Ohtani6%$635 avg
- Victor Wembanyama6%$476 avg
- Bob Lanier3%$1,701 avg
- Dante Moore3%$650 avg
- Gunnar Henderson3%$375 avg
Built from the 32 indexed pulls of this pack so far — a record of what has come out, not a promise about what is left.
04 / Floor safety
Sports Inferno floor safety & buyback reality
In Sports Inferno, the top 2% of pulls account for 12% of all pulled value — low dilution. Value is spread fairly evenly across the pool, so the average is close to what a typical rip returns. The observed instant-offer ratio is 90% of FMV, which is the cash number every verdict on this page already uses.
Floor safety
low dilution12% of everything this pack has paid out came from just the top 2% of pulls. Value is spread broadly across pulls, so the average sits closer to the typical rip here than it does on a top-heavy pack. It still sits above the median — check both.
Buyback reality
89.6% of FMV observedAcross 32 indexed pulls that carry a recorded bid, a $100 FMV pull cashes out around $90 if you instant-sell — better than the platform's 84.6%. This is the figure every verdict on the site multiplies by.
Holding, listing, or physically redeeming can beat the instant offer — but redemption shipping (typically $16+) eats small wins.
Net exit value
32 paired pulls · 100% bid coverage · confidence 75%Instant-selling the average (mean) pull here returns $631.24 — $73.27 below sticker FMV (10.4% haircut). That figure is the average of bids we actually recorded, not the platform rate applied blind.
Pro compares all three exits side by side, with the redemption breakeven and the value-by-value haircut curve for this pack.
Bids are recorded, resale is not. Instant-buyback figures are real offers captured at index time and can move. Redemption shipping starts near $16 in the US, is higher internationally, and is charged per shipment — batching pulls lowers it. We publish no resale estimate, liquidity score, or time-to-sell, because no such data is available to us. How buyback works
05 / Observed odds
Sports Inferno odds — observed, not posted
- Under $295
- $295 – $589
- $589 – $1,178 · beats the pack
- $1,178 – $2,945 · big hit
- $2,945+ · chase
Observed across 32 indexed pulls — what actually came out of this pack, independent of the posted odds. The 48h column shows tier drift: a falling green tier means fewer of the good cards have come out lately — which may mean they are running out, or may just be a quiet 48 hours.
07 / Big hits
Biggest Sports Inferno pulls
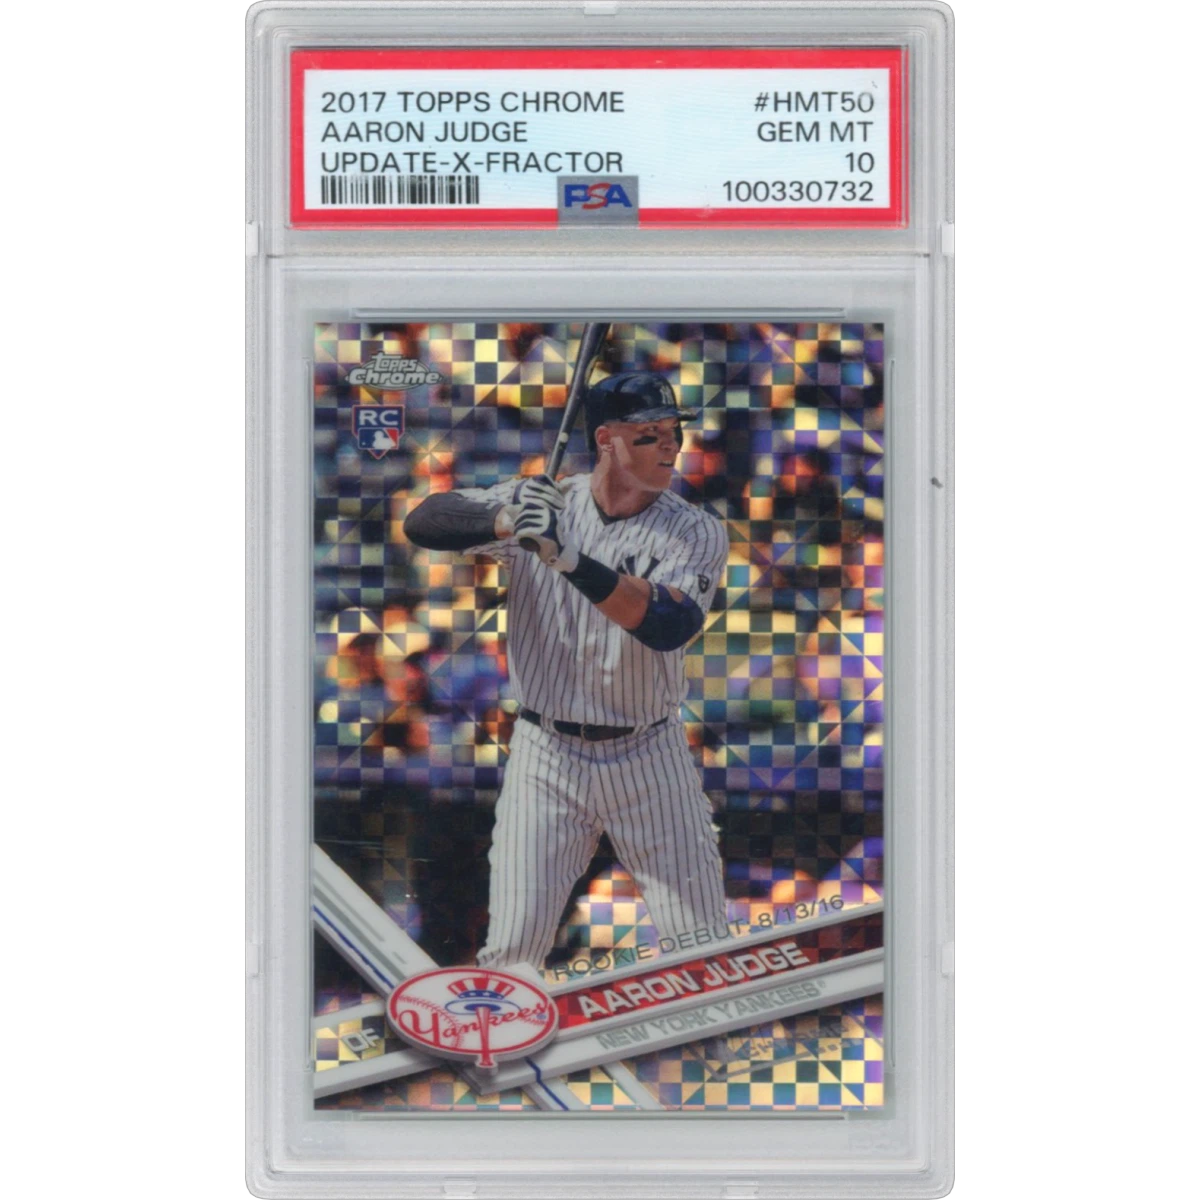
2017 Topps Chrome Update #HMT50 Aaron Judge - X-Fractor (PSA 10 GEM MINT)
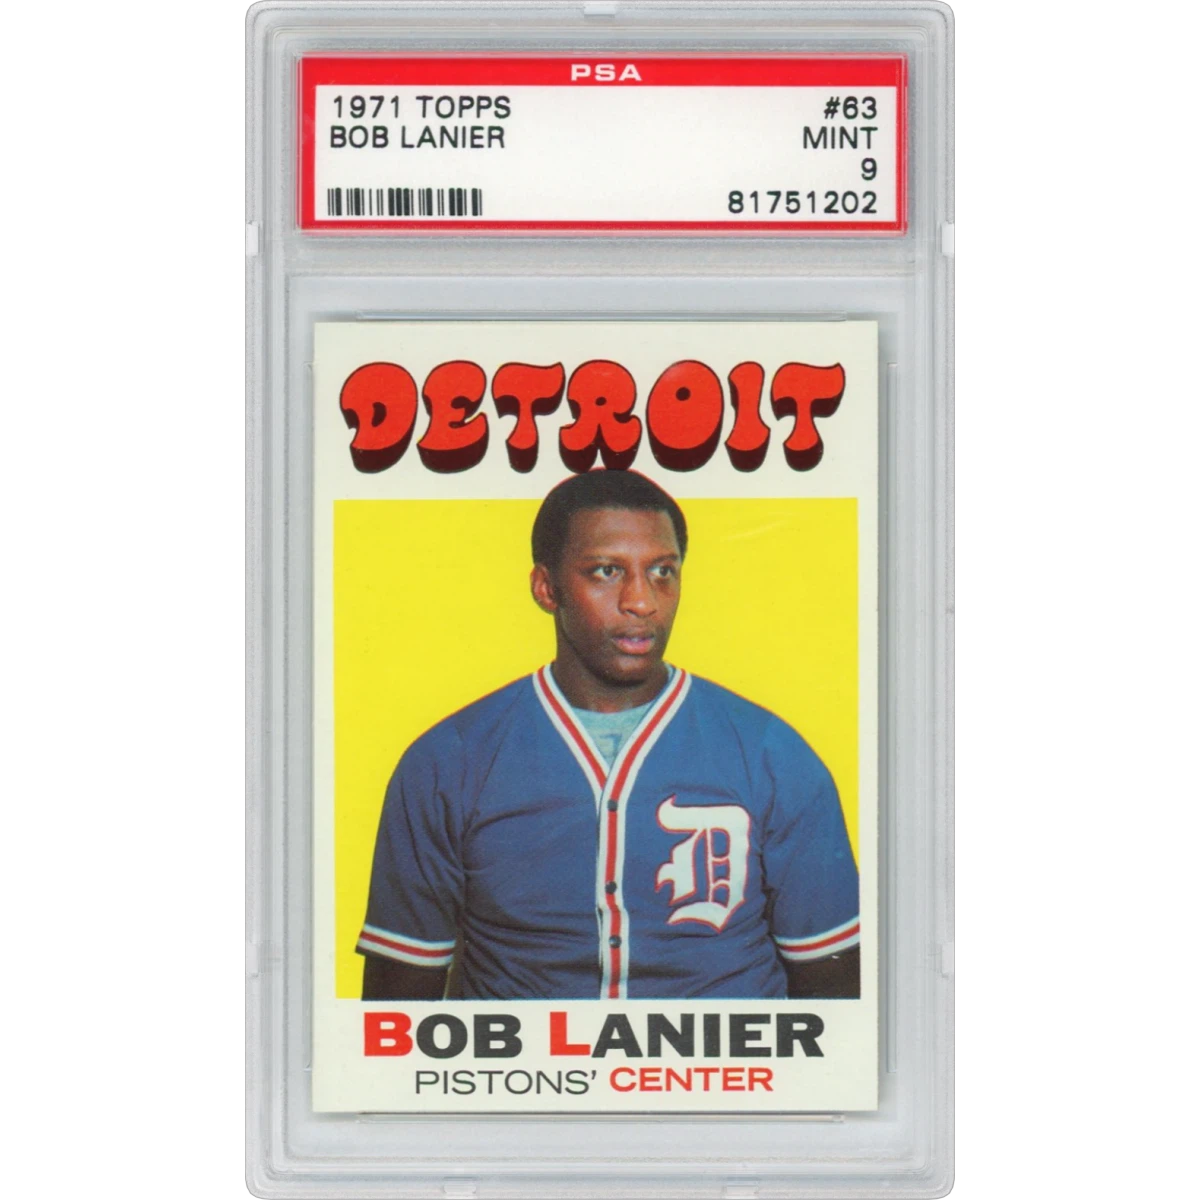
1971 Topps #63 Bob Lanier (PSA 9 MINT)
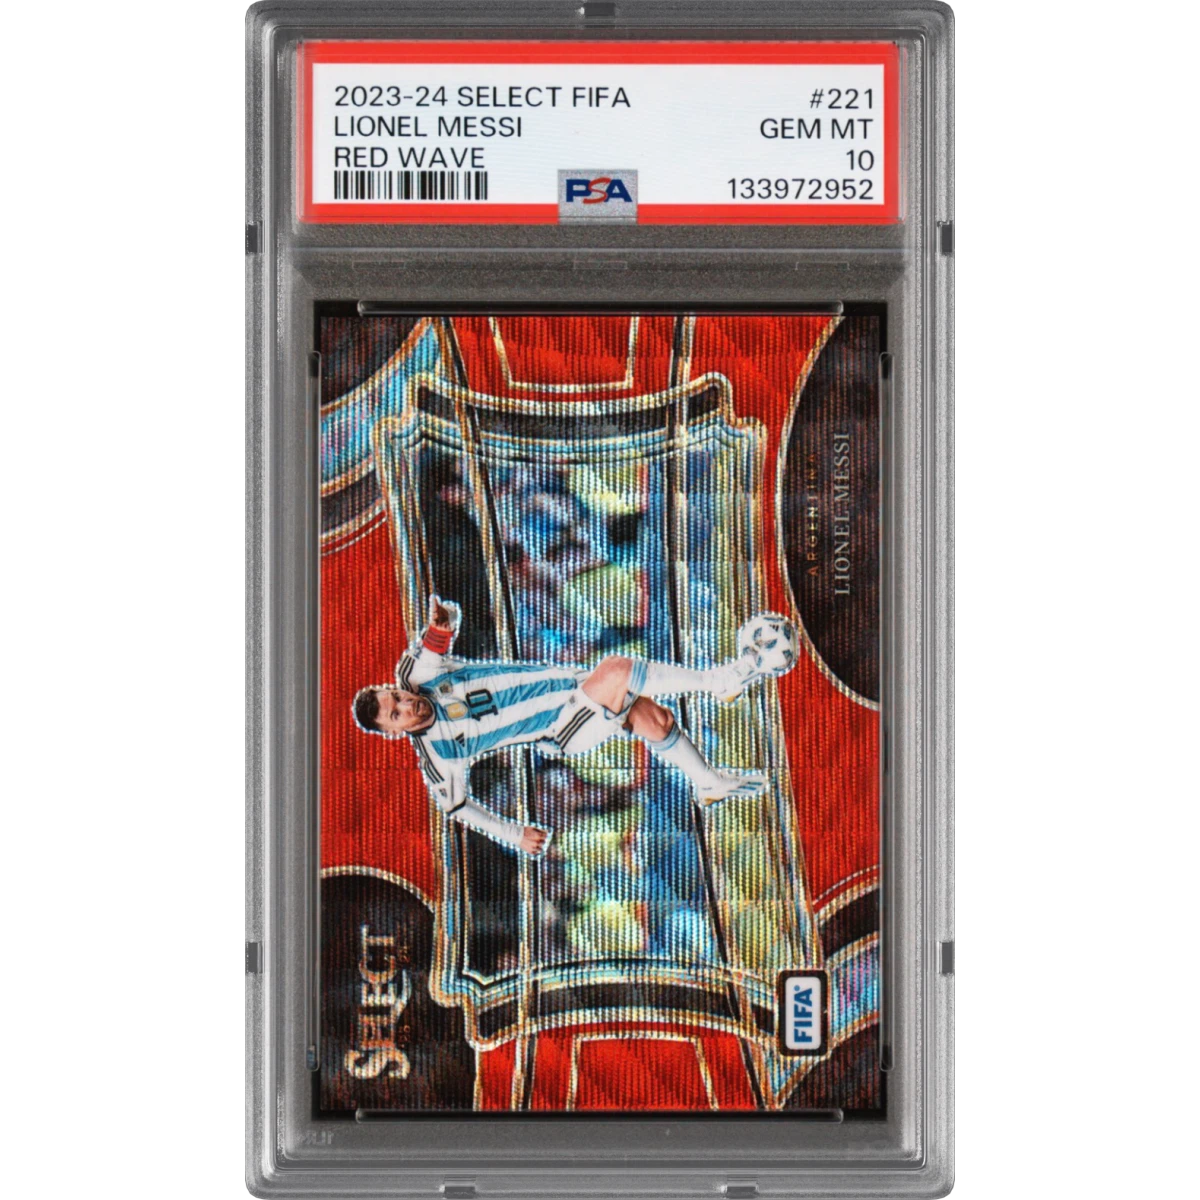
2023-24 Panini Select FIFA #221 Lionel Messi - Red Wave (PSA 10 GEM MINT)
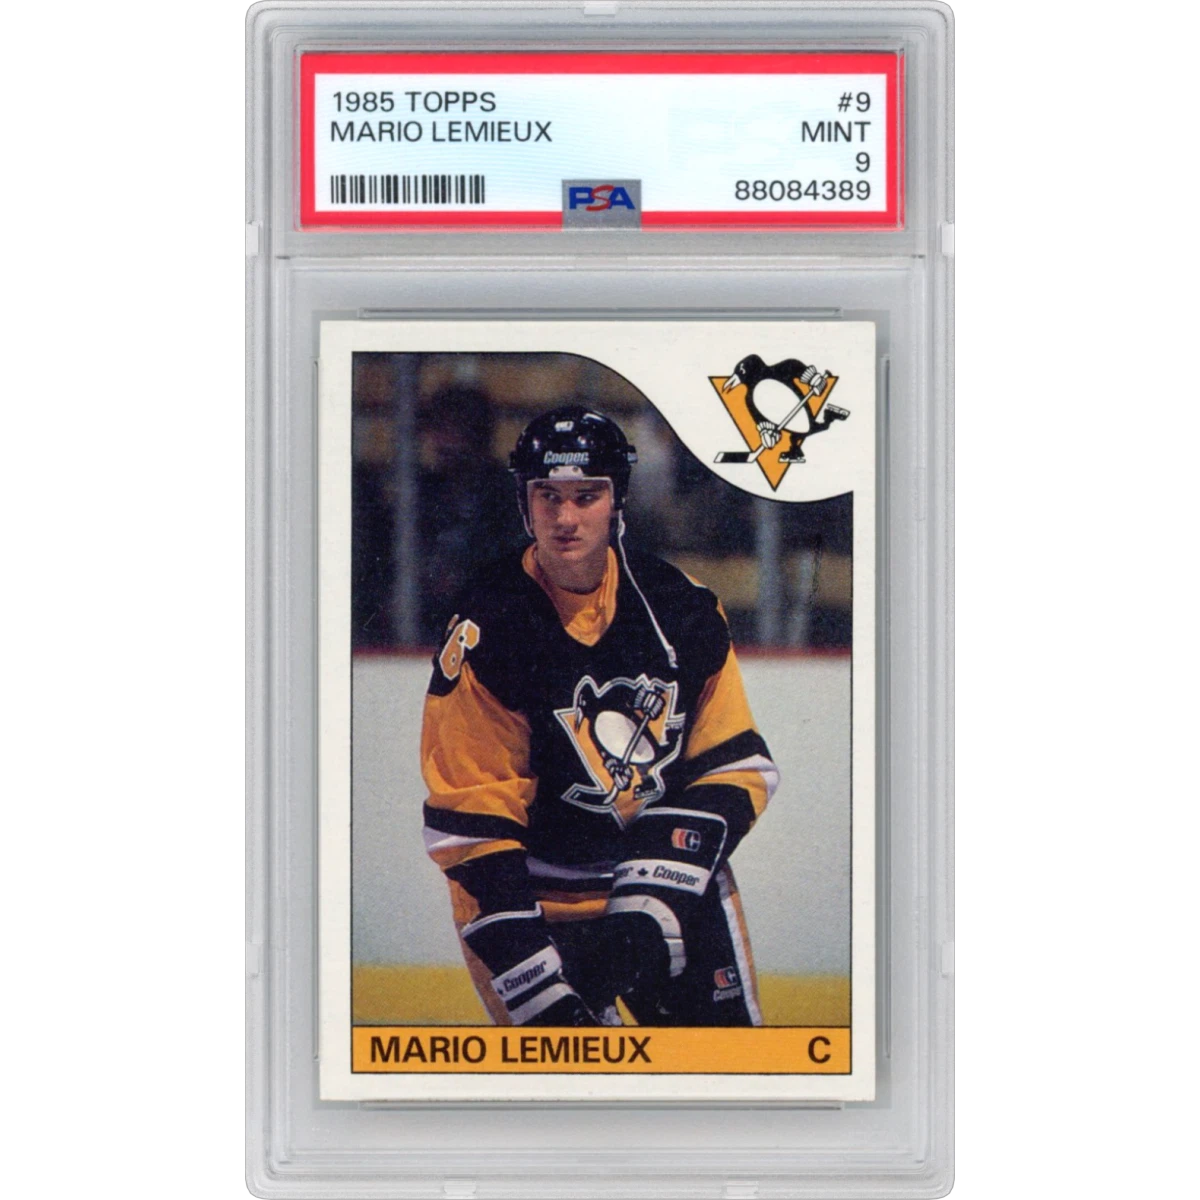
1985 Topps #9 Mario Lemieux (PSA 9 MINT)
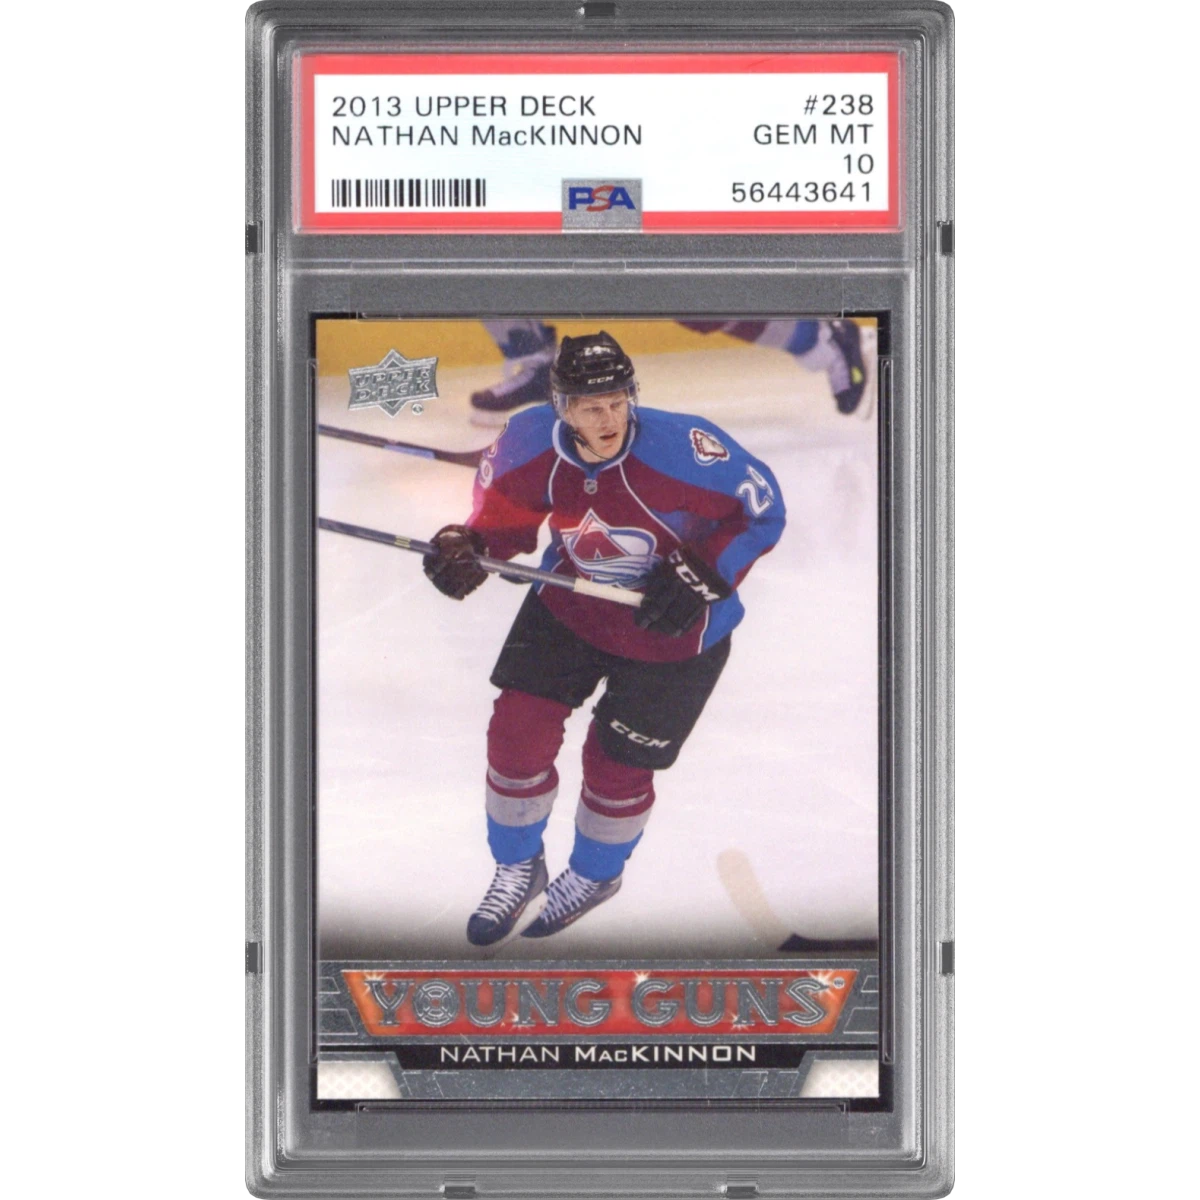
2013 Upper Deck #238 Nathan MacKinnon (PSA 10 GEM MINT)
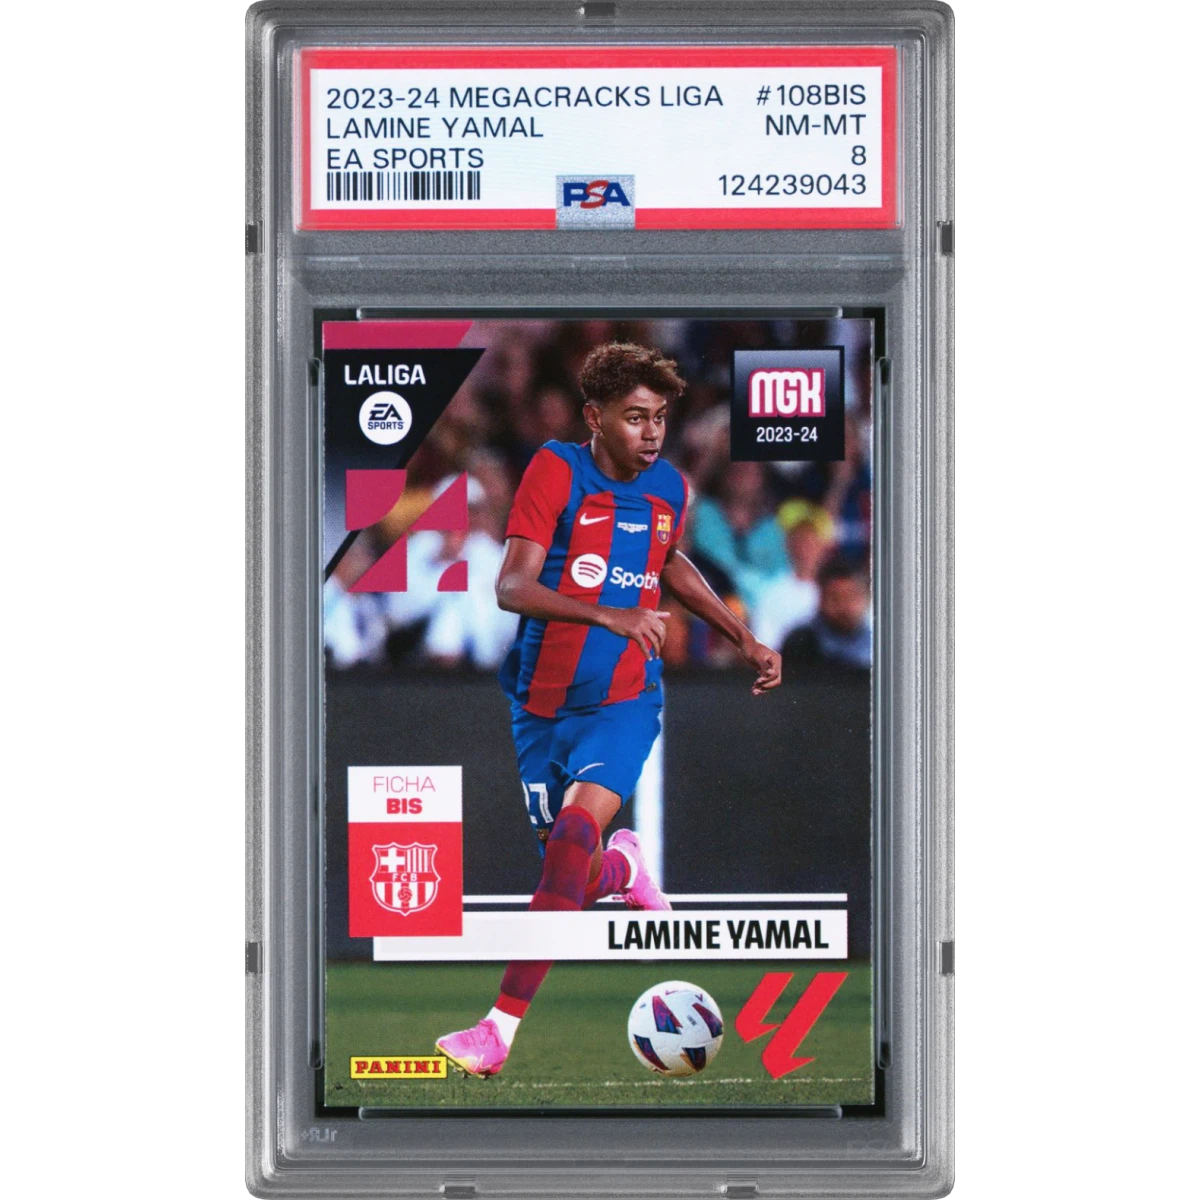
2023-24 Panini Megacracks Laliga EA Sports #108BIS Lamine Yamal (PSA 8 NM-MT)
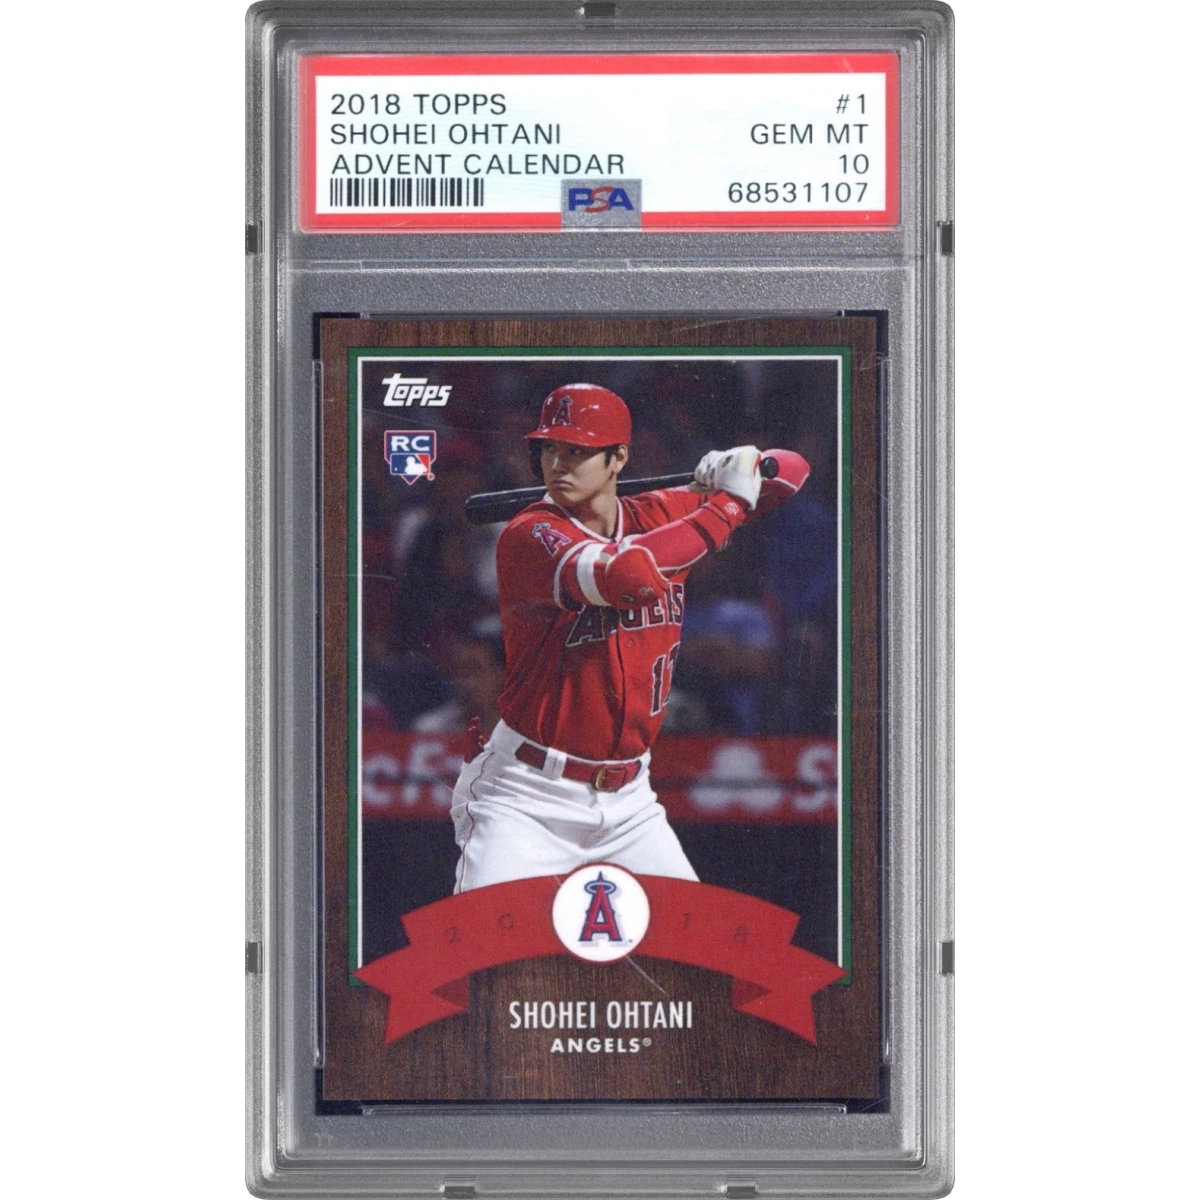
2018 Topps Advent Calendar #1 Shohei Ohtani (PSA 10 GEM MINT)
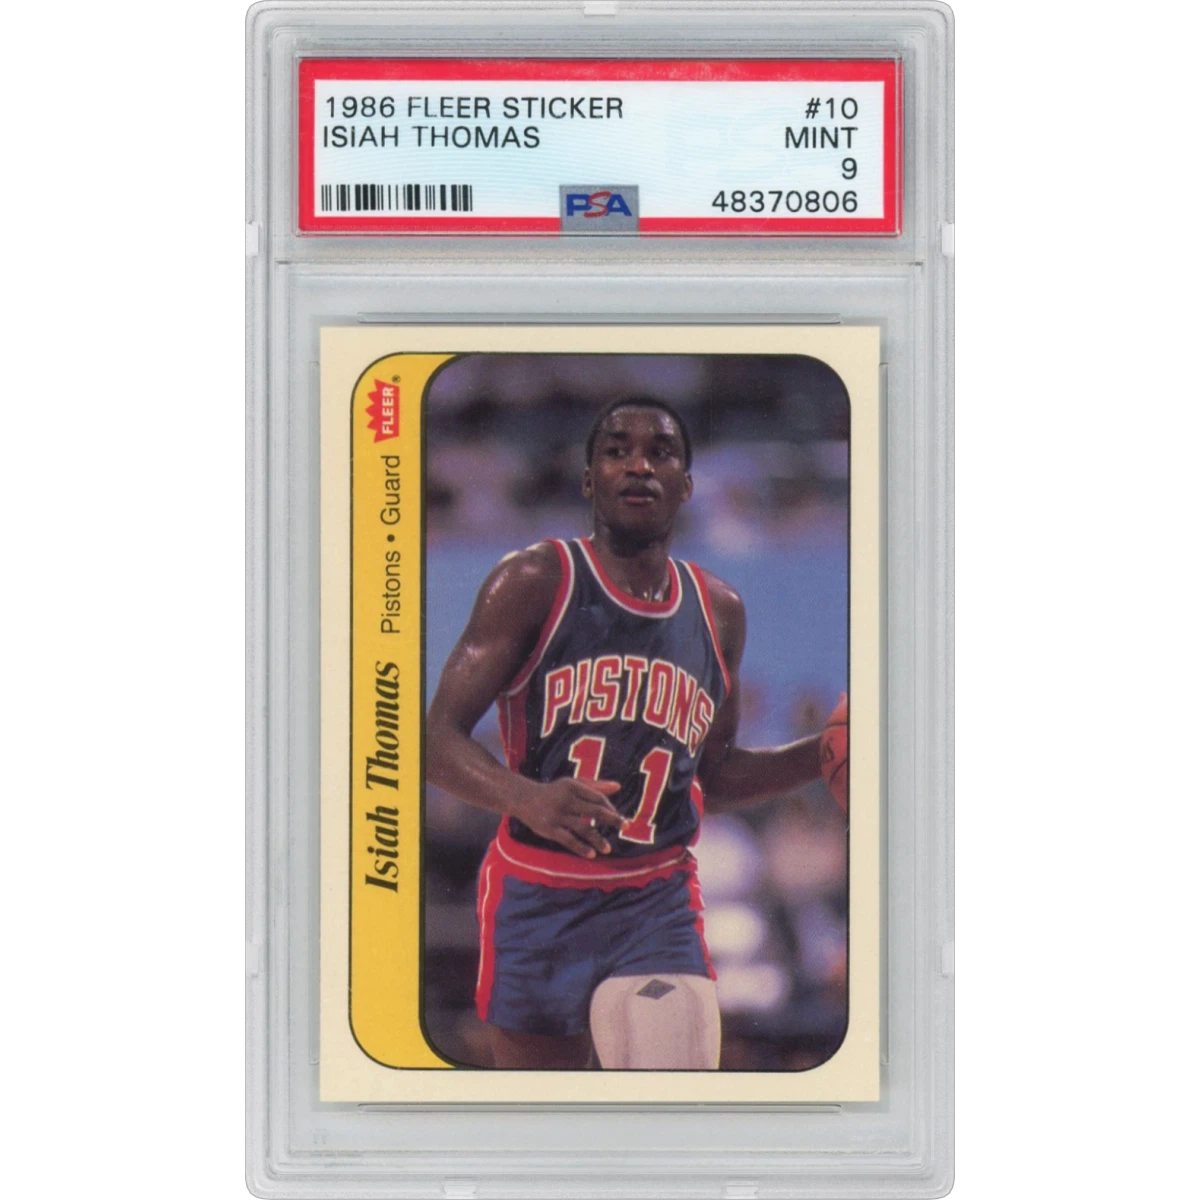
1986 Fleer Sticker #10 Isiah Thomas (PSA 9 MINT)
08 / EV history
Sports Inferno EV over time
Calibrated EV currently sits at $708.47, and has moved up 0.0% over the last 7 days.
EV over time: 579 points from Nov 15 to Nov 21, starting at $708 and ending at $708, essentially flat across the period.
09 / Quick answers
Sports Inferno — quick answers
- Is Sports Inferno worth buying right now?
- Our current verdict is NO DATA (score 0/100). No pack price on record, so no net or ROI figure can be computed.
- What is the EV of Sports Inferno?
- The calibrated EV is $708.47 against a pack price of not yet set, with a typical (median) pull of $589.00 across 32 indexed pulls.
- What are the real odds of beating the pack price on Sports Inferno?
- We cannot say yet. Sports Inferno has no pack price on record, and the odds of beating a price are undefined until there is one to beat. The 32 indexed pulls are still shown below as a record of what has come out.
- What is the typical pull from Sports Inferno?
- The median pull is $589.00 — half of all indexed rips returned less than that. The single best recorded pull is $2,660.00.
10 / Pull log
Latest Sports Inferno pulls
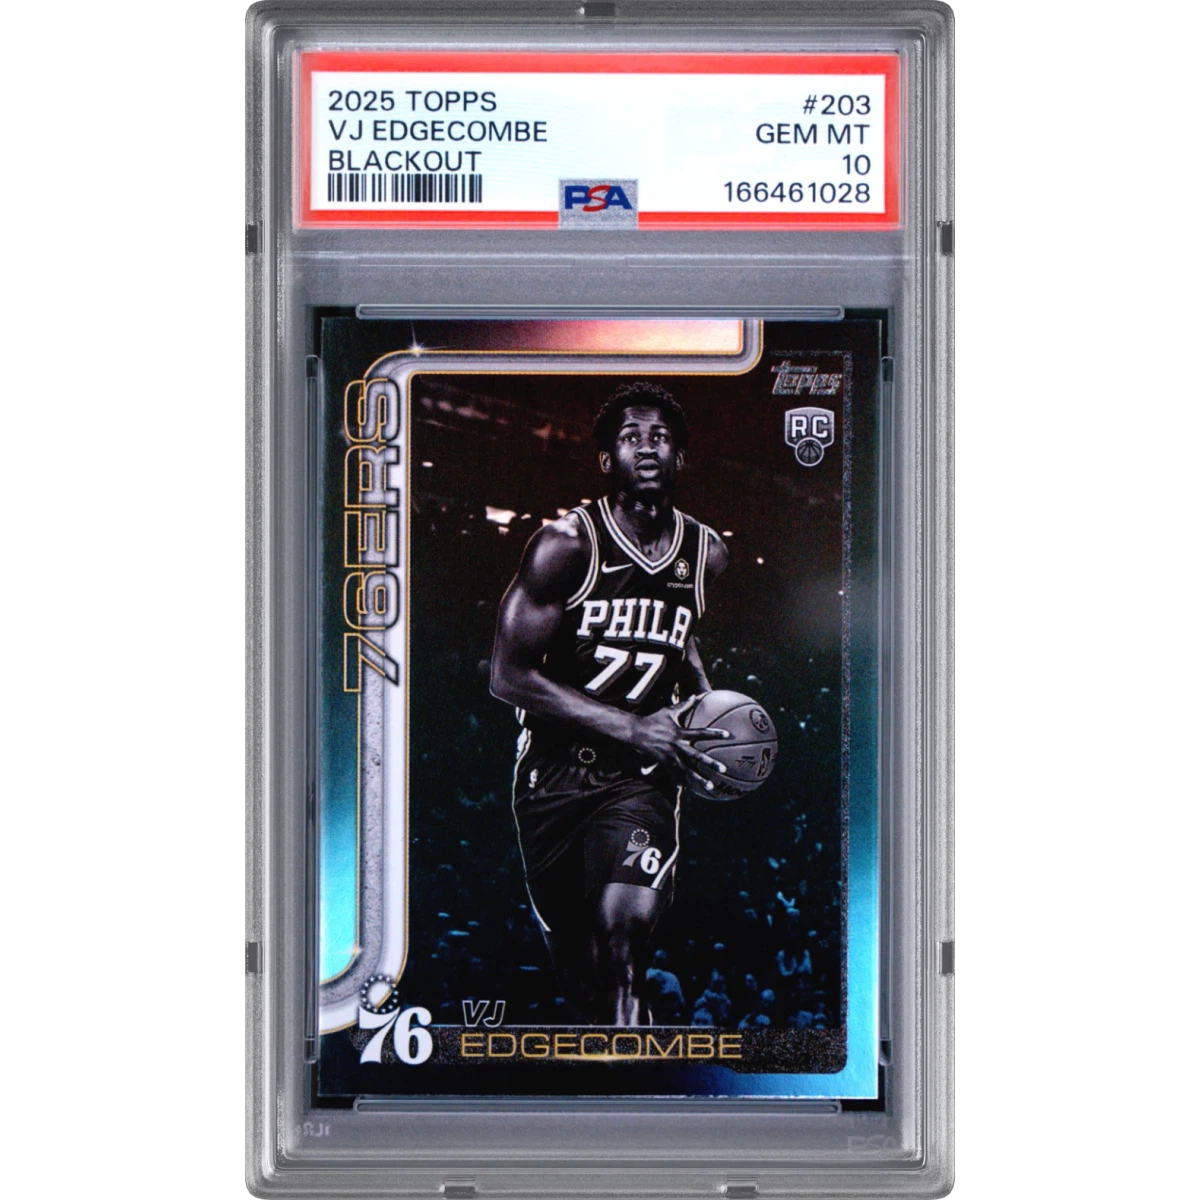 2025 Topps #203 VJ Edgecombe - Blackout (PSA 10 GEM MINT)$388.0047d ago
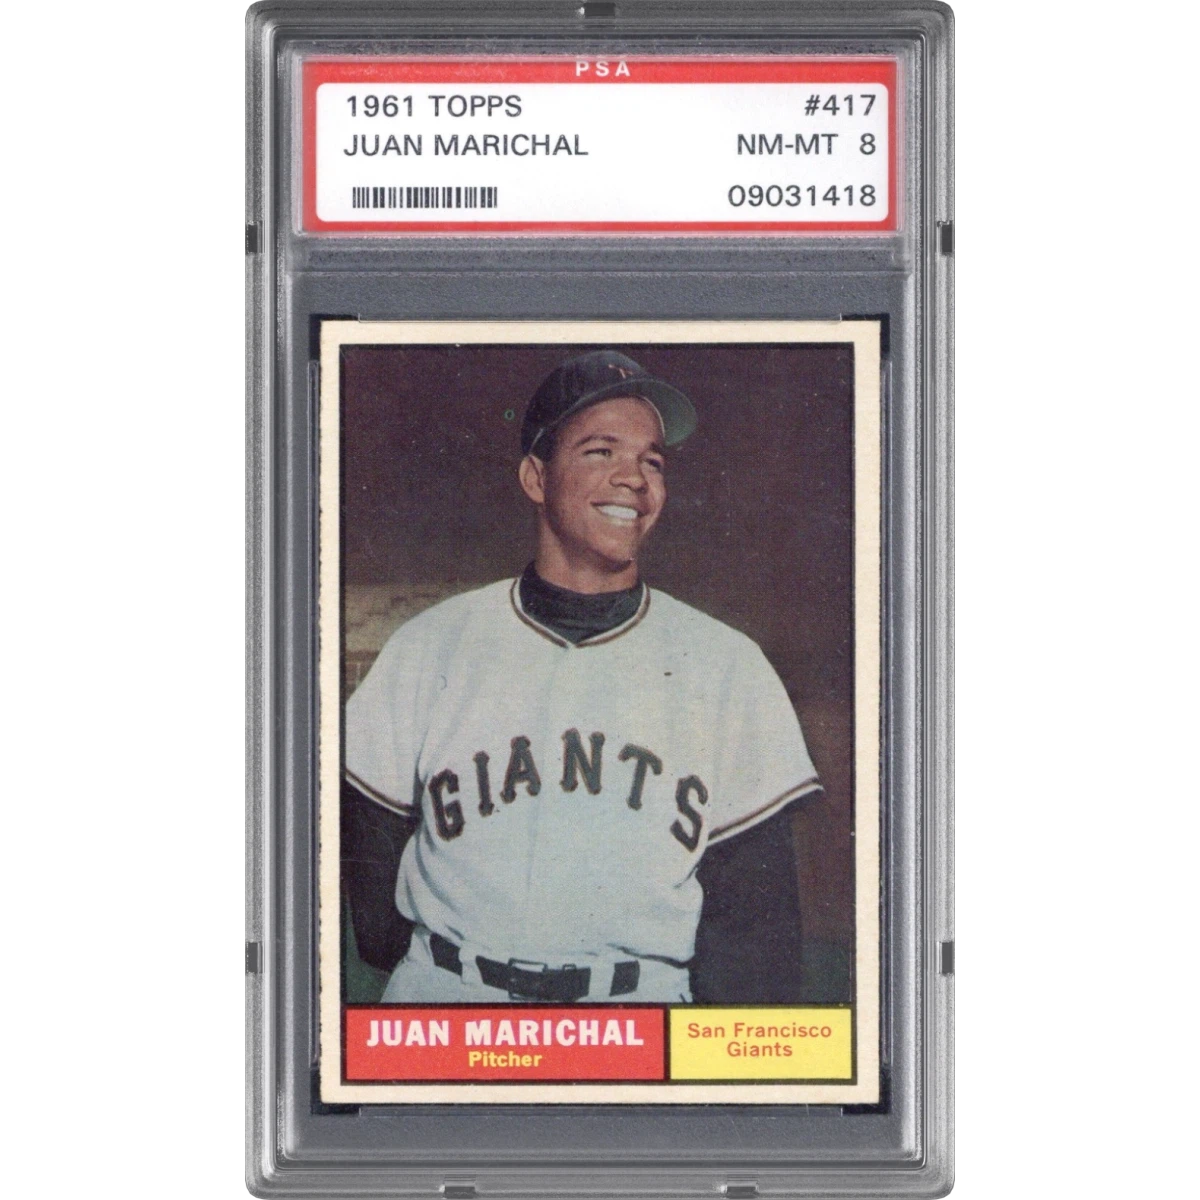 1961 Topps #417 Juan Marichal (PSA 8 NM-MT)$611.0047d ago
- 2018 Topps Advent Calendar #1 Shohei Ohtani (PSA 10 GEM MINT)$847.1047d ago
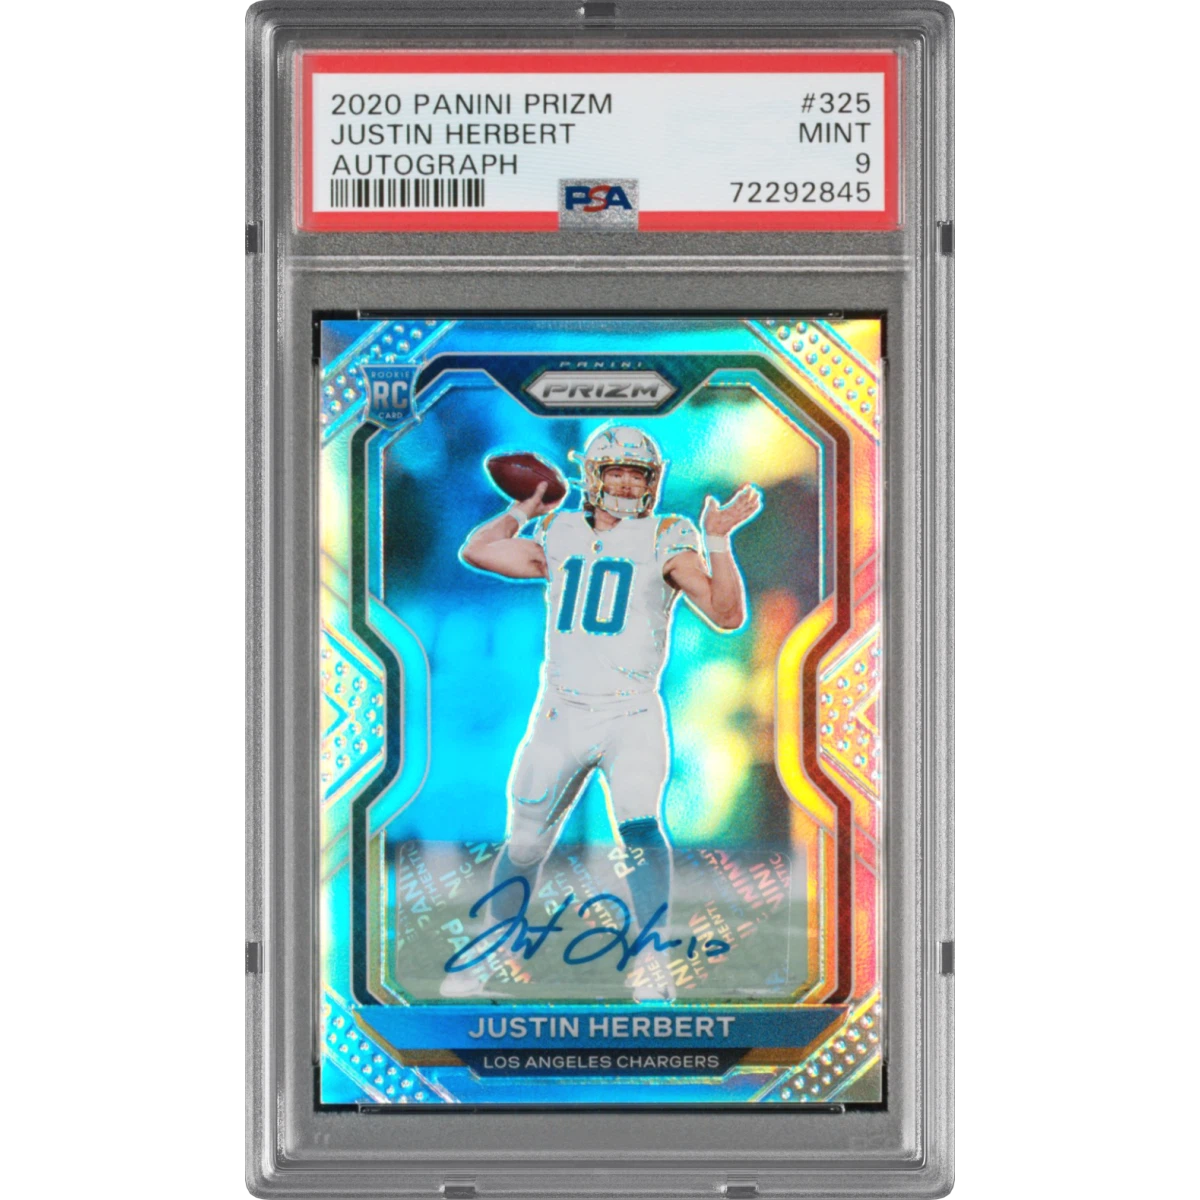 2020 Panini Prizm #325 Justin Herbert - Autograph (PSA 9 MINT)$629.0047d ago
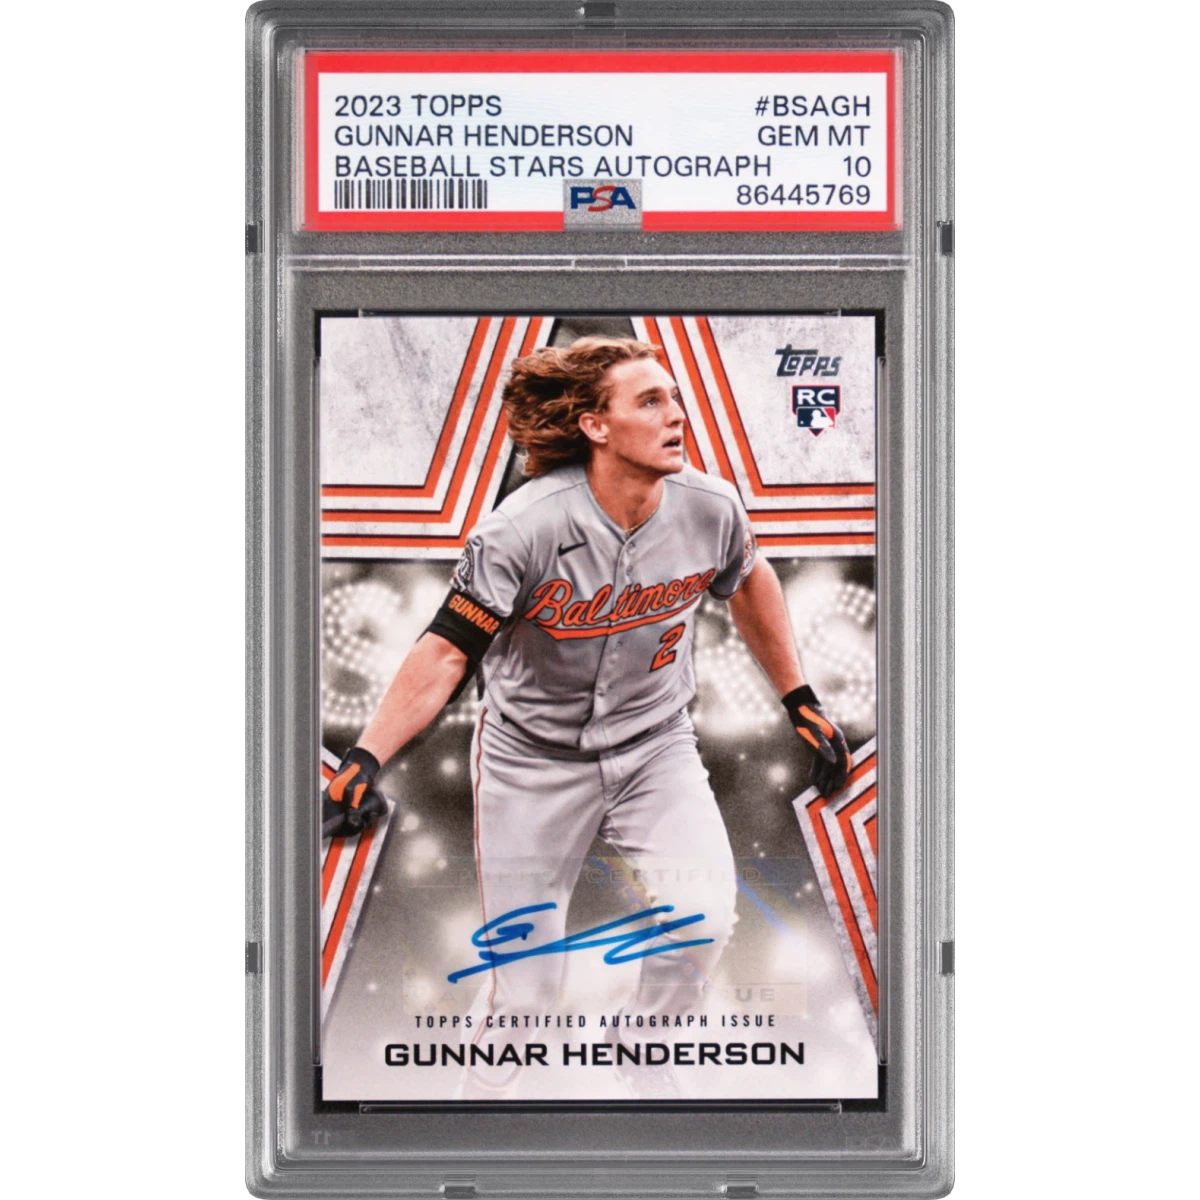 2023 Topps Baseball Stars Autographs #BSAGH Gunnar Henderson (PSA 10 GEM MINT)$375.0047d ago
- 1971 Topps #63 Bob Lanier (PSA 9 MINT)$1,700.5047d ago
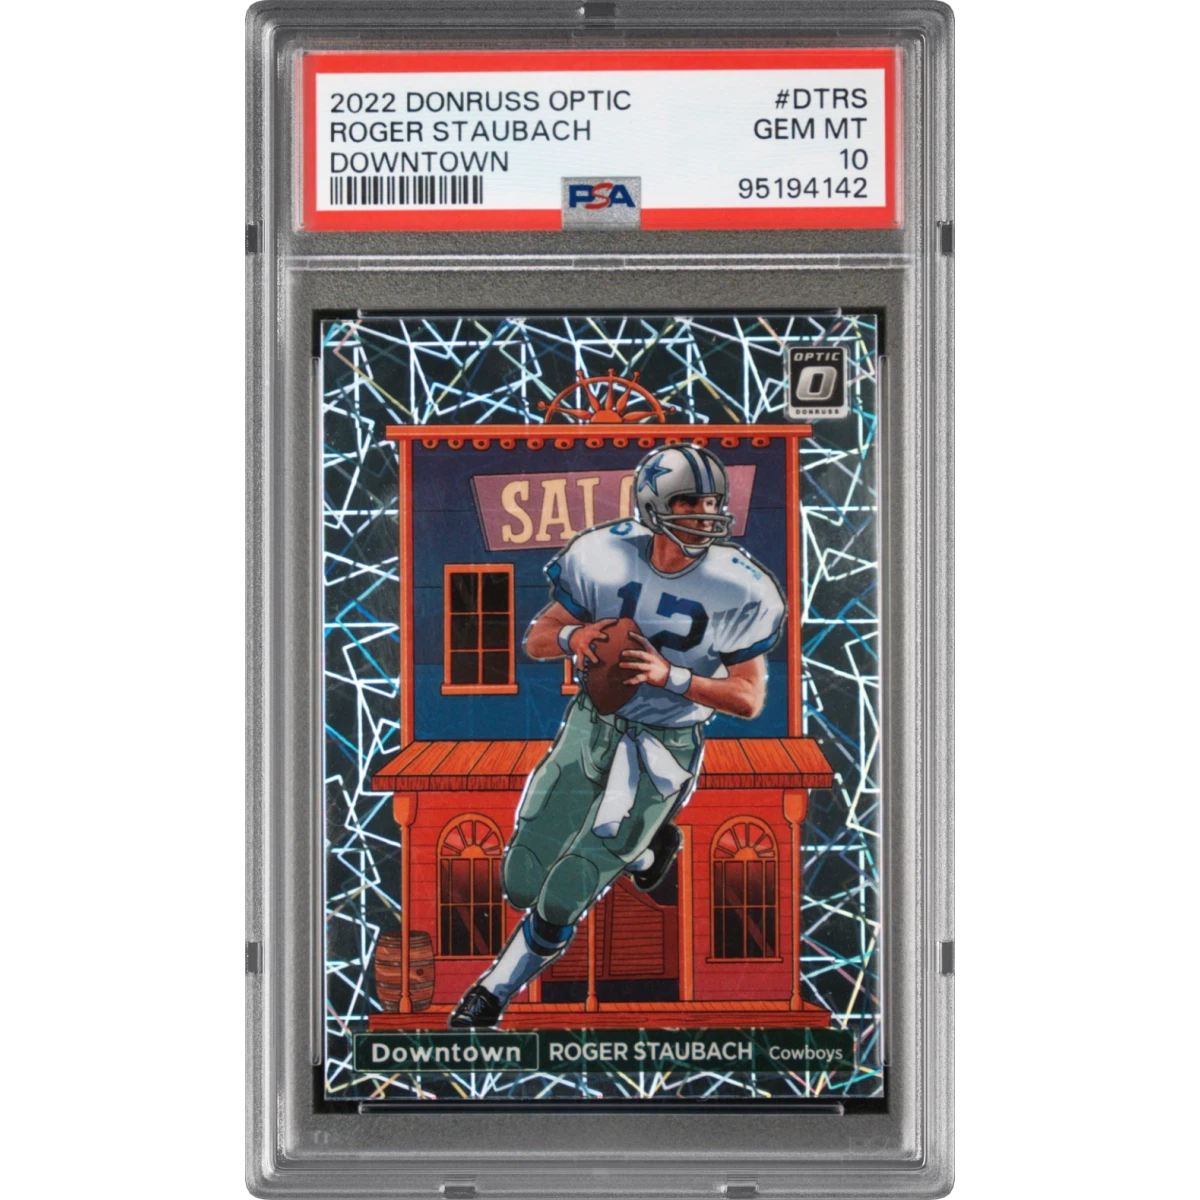 2022 Panini Donruss Optic Downtown #DTRS Roger Staubach (PSA 10 GEM MINT)$613.8047d ago
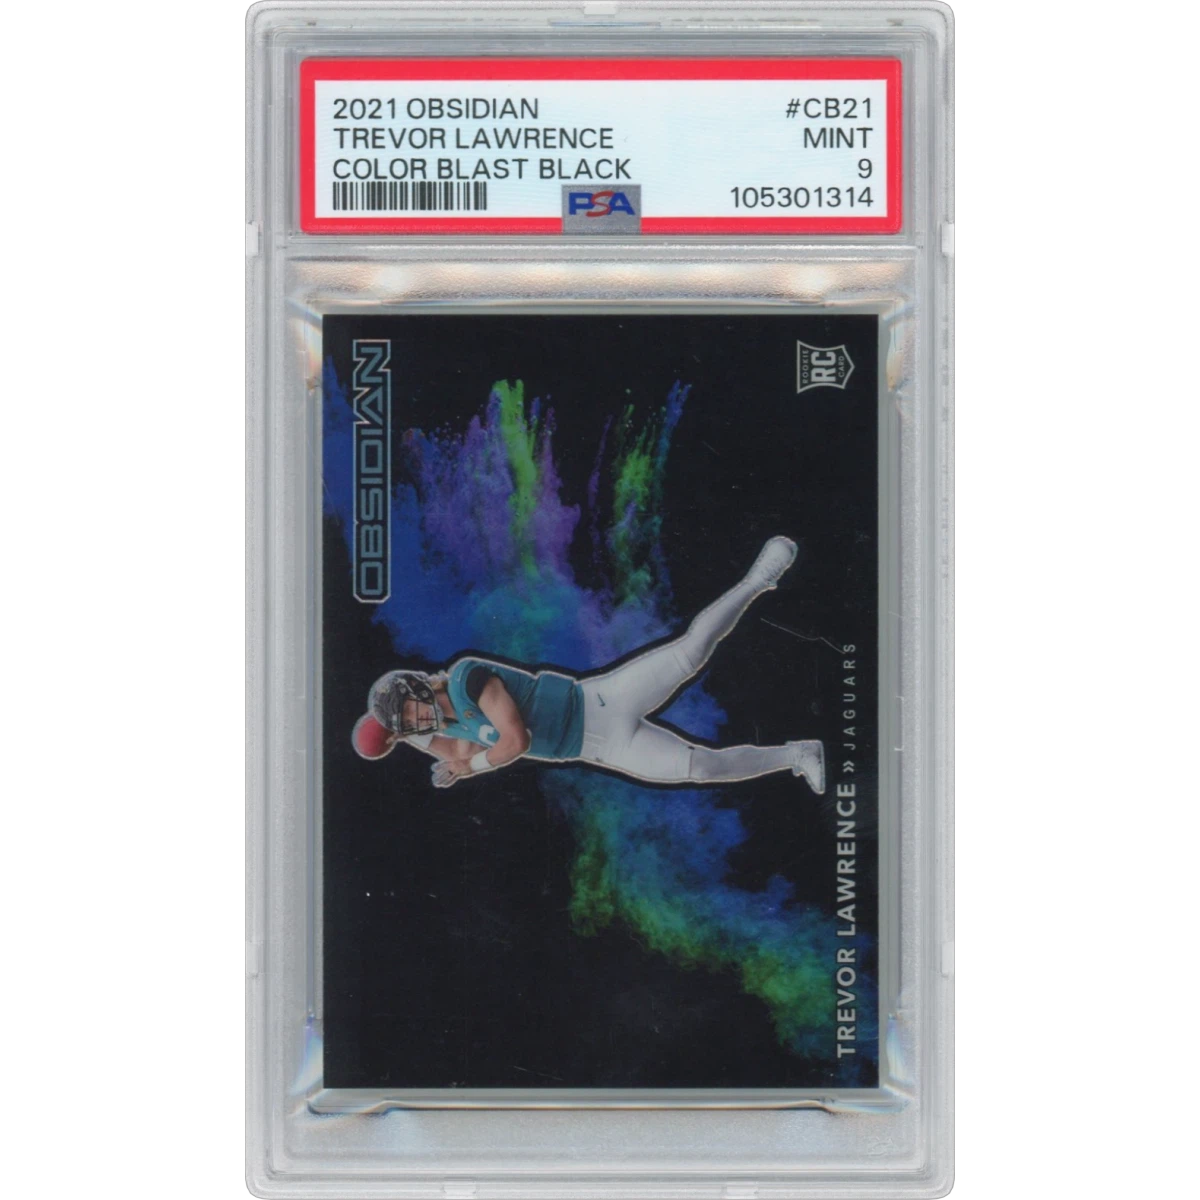 2021 Panini Obsidian Color Blast Black #CB21 Trevor Lawrence (PSA 9 MINT)$682.0047d ago
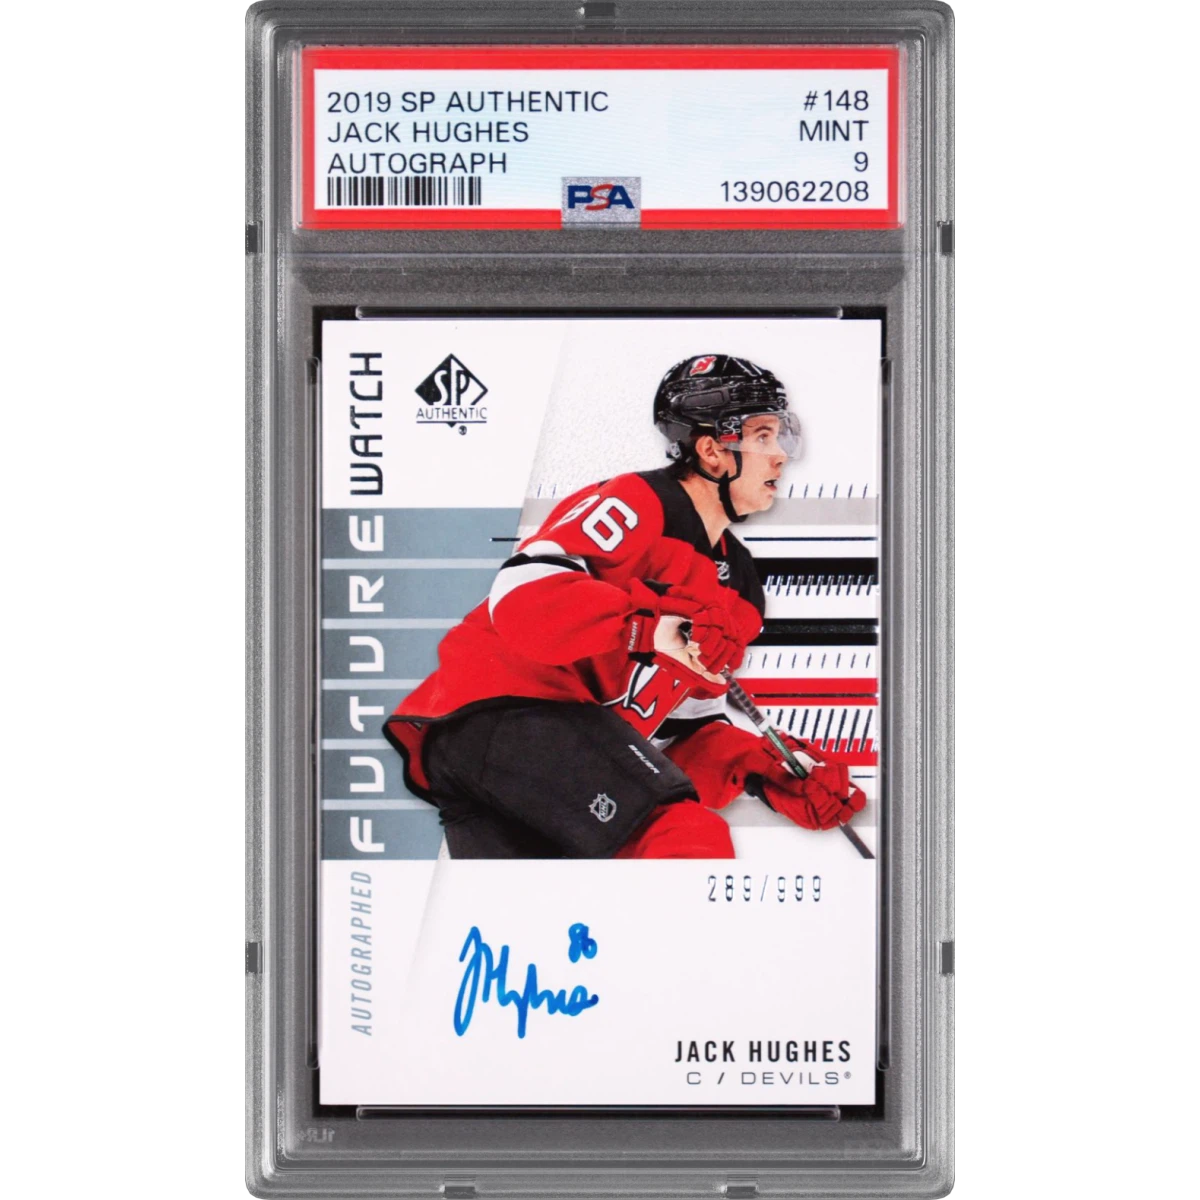 2019 SP Authentic #148 Jack Hughes - Autograph (PSA 9 MINT)$531.0047d ago
- 1985 Topps #9 Mario Lemieux (PSA 9 MINT)$1,088.6048d ago
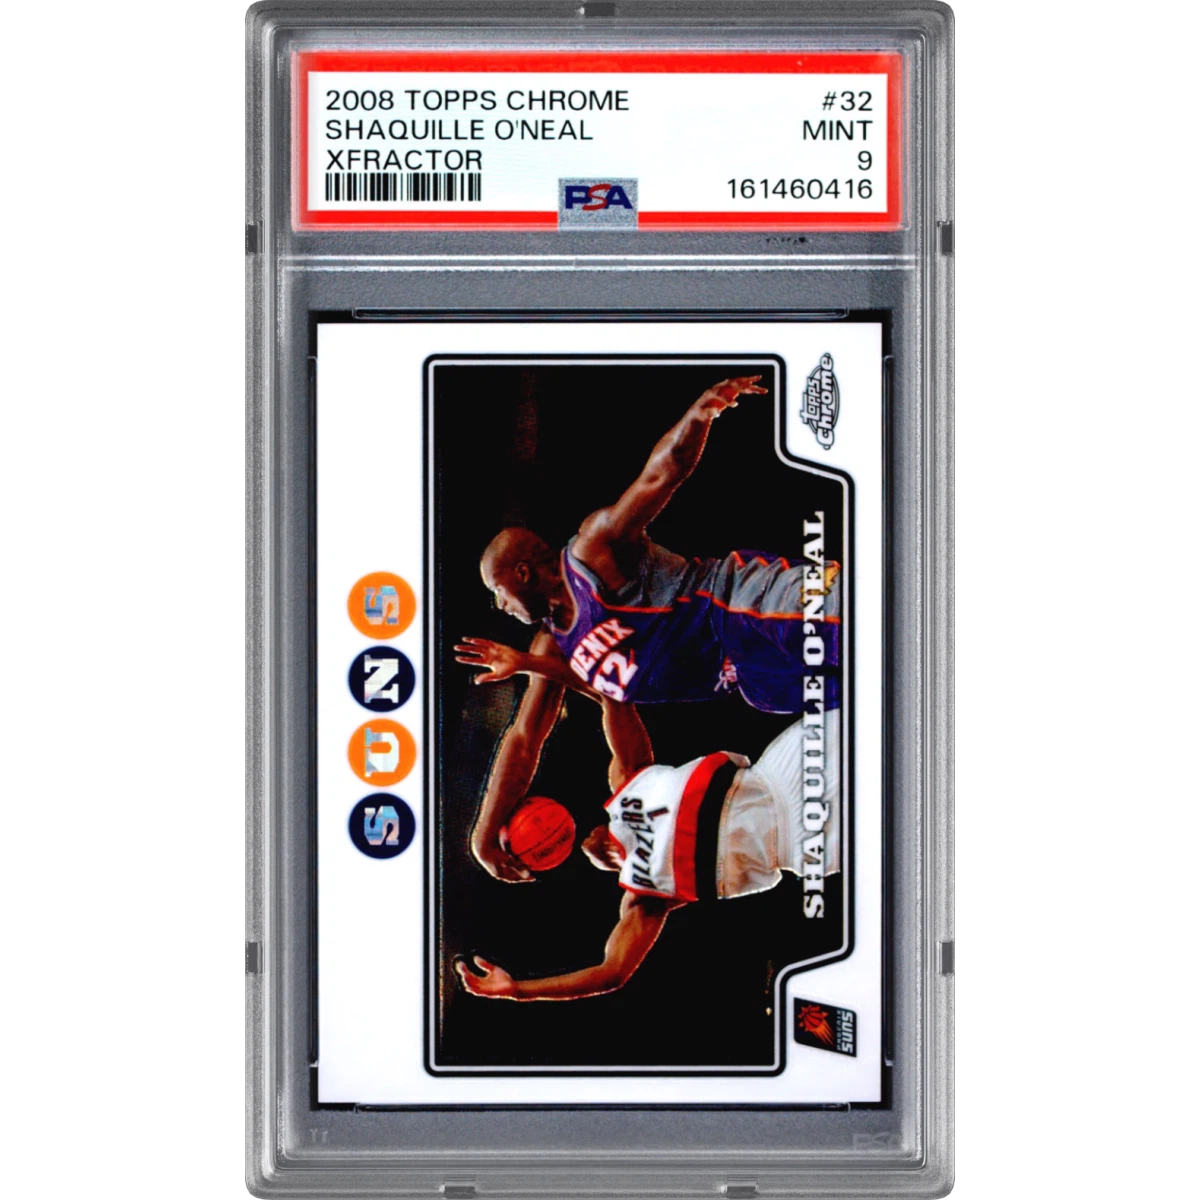 2008 Topps Chrome #32 Shaquille O'Neal - Xfractor (PSA 9 MINT)$485.0048d ago
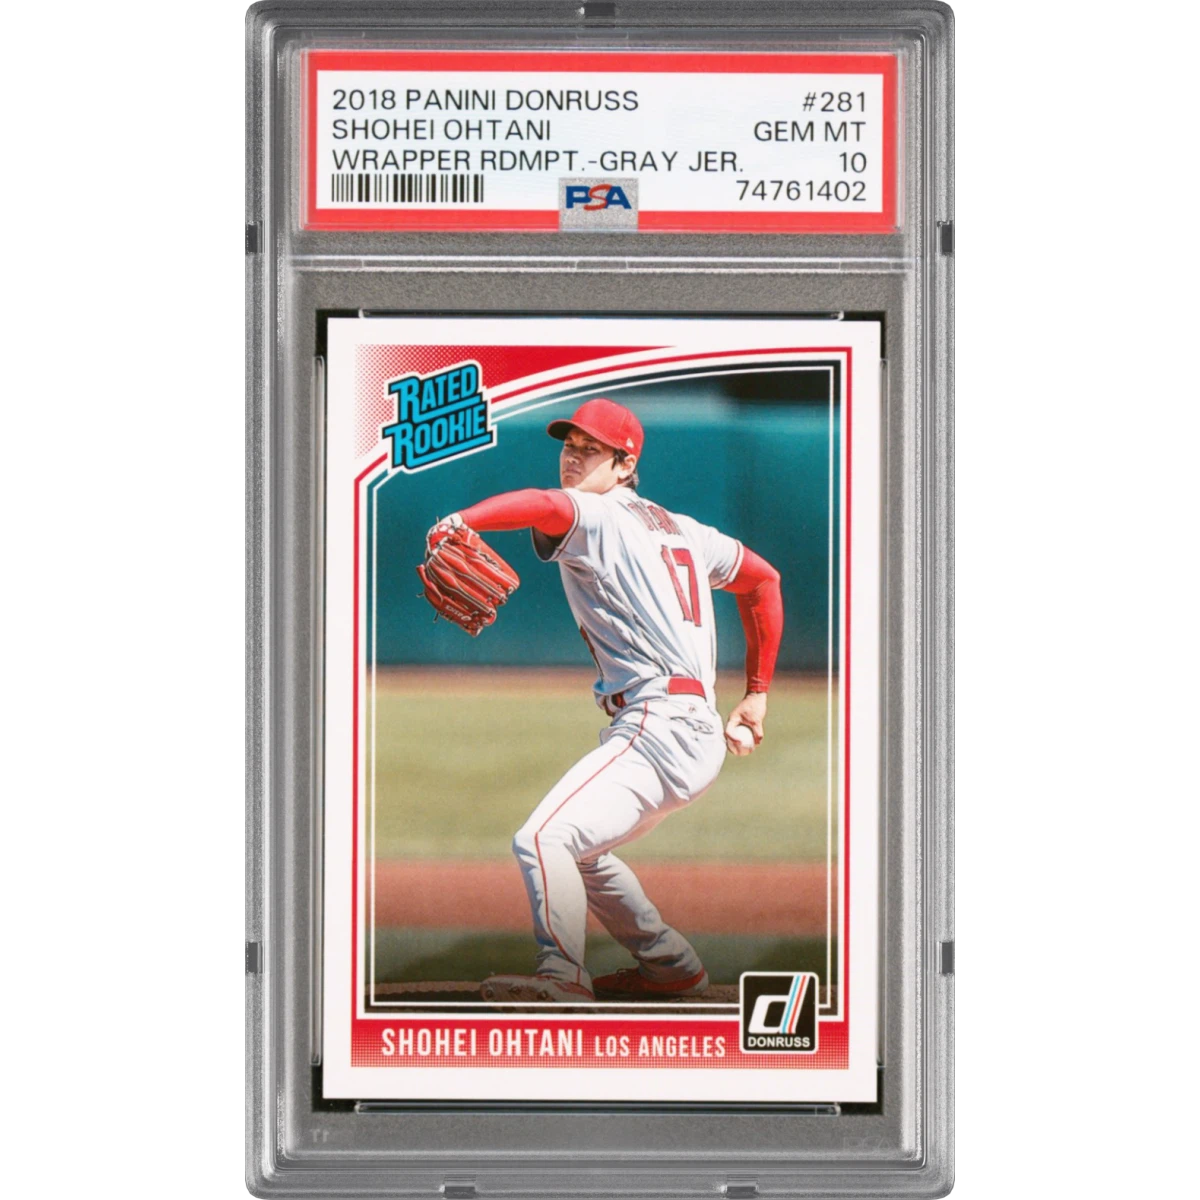 2018 Panini Donruss #281 Shohei Ohtani - Wrapper Redemption (PSA 10 GEM MINT)$422.1048d ago
- 2023-24 Panini Select FIFA #221 Lionel Messi - Red Wave (PSA 10 GEM MINT)$1,157.0048d ago
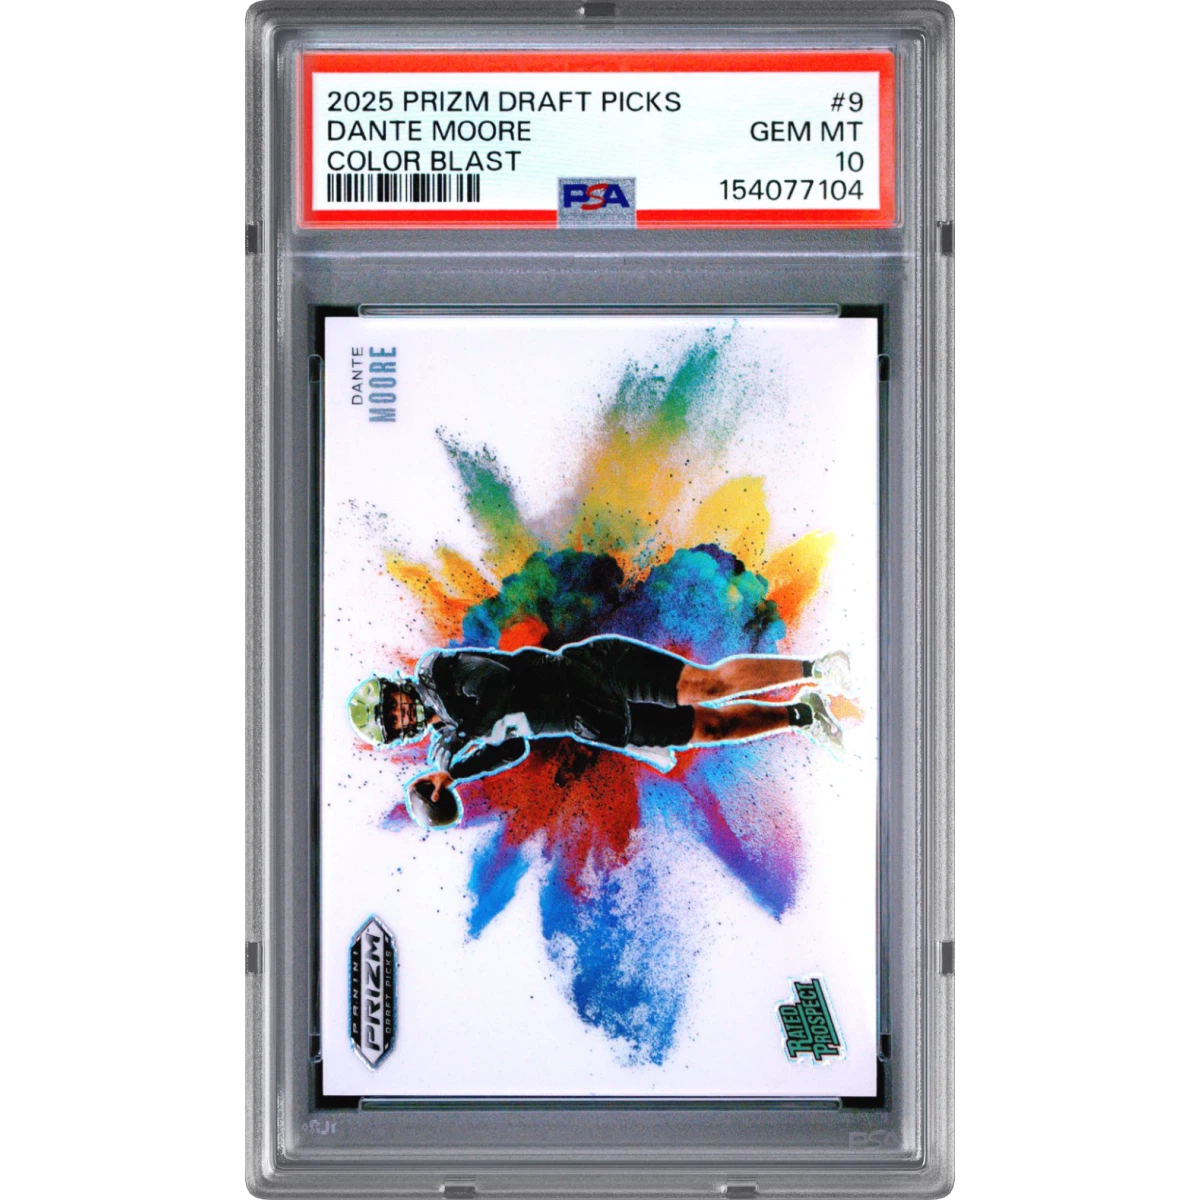 2025 Panini Prizm Draft Picks Color Blast #9 Dante Moore (PSA 10 GEM MINT)$650.0048d ago
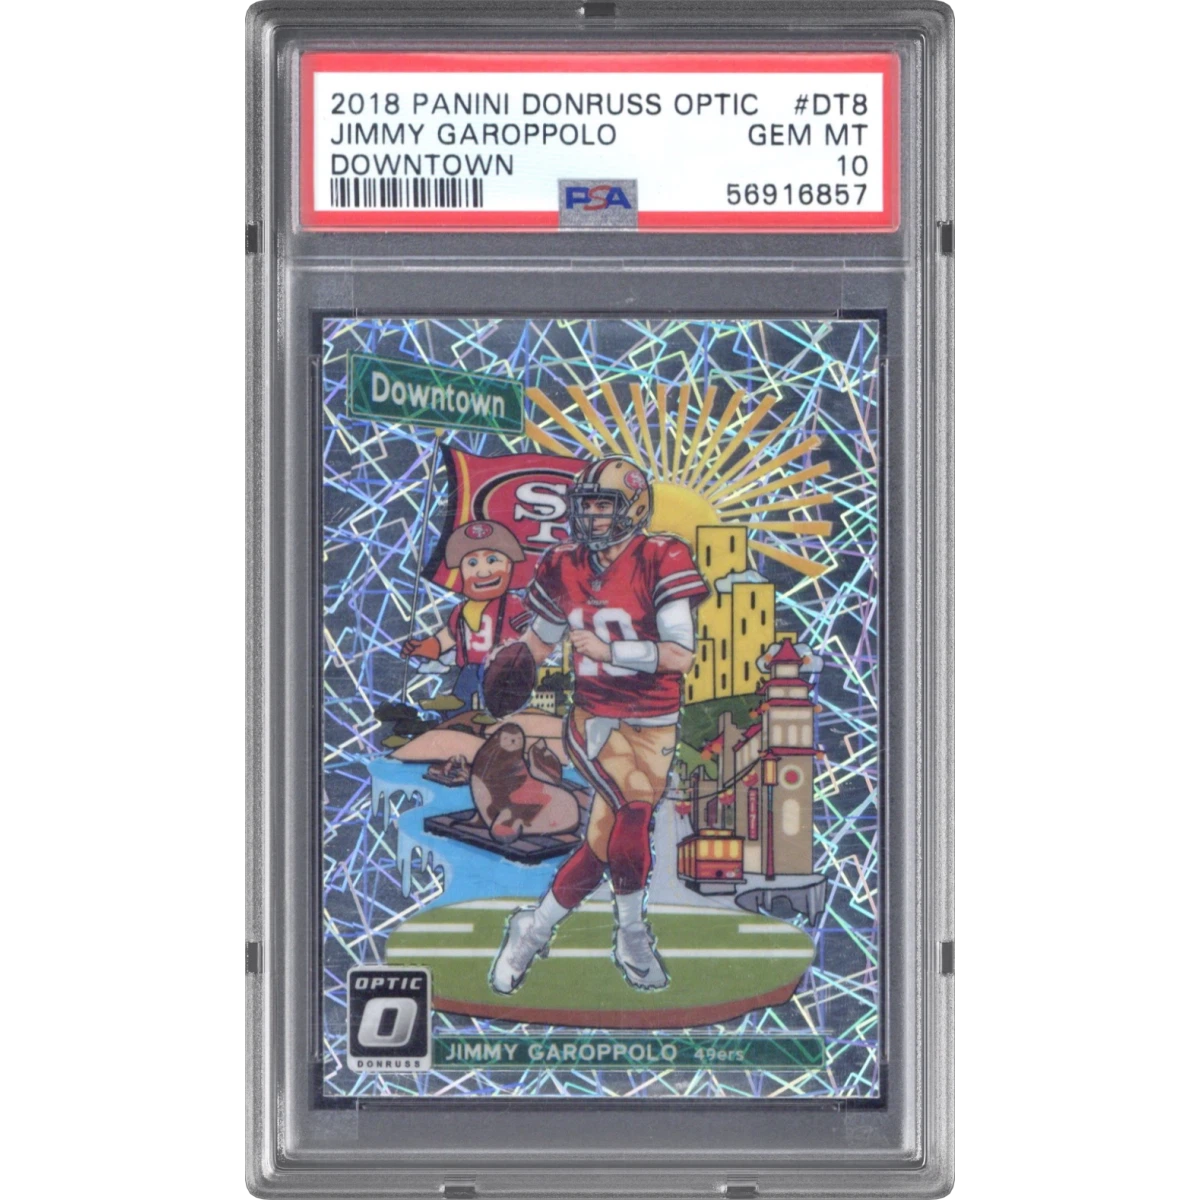 2018 Panini Donruss Optic Downtown #DT8 Jimmy Garoppolo (PSA 10 GEM MINT)$470.0048d ago
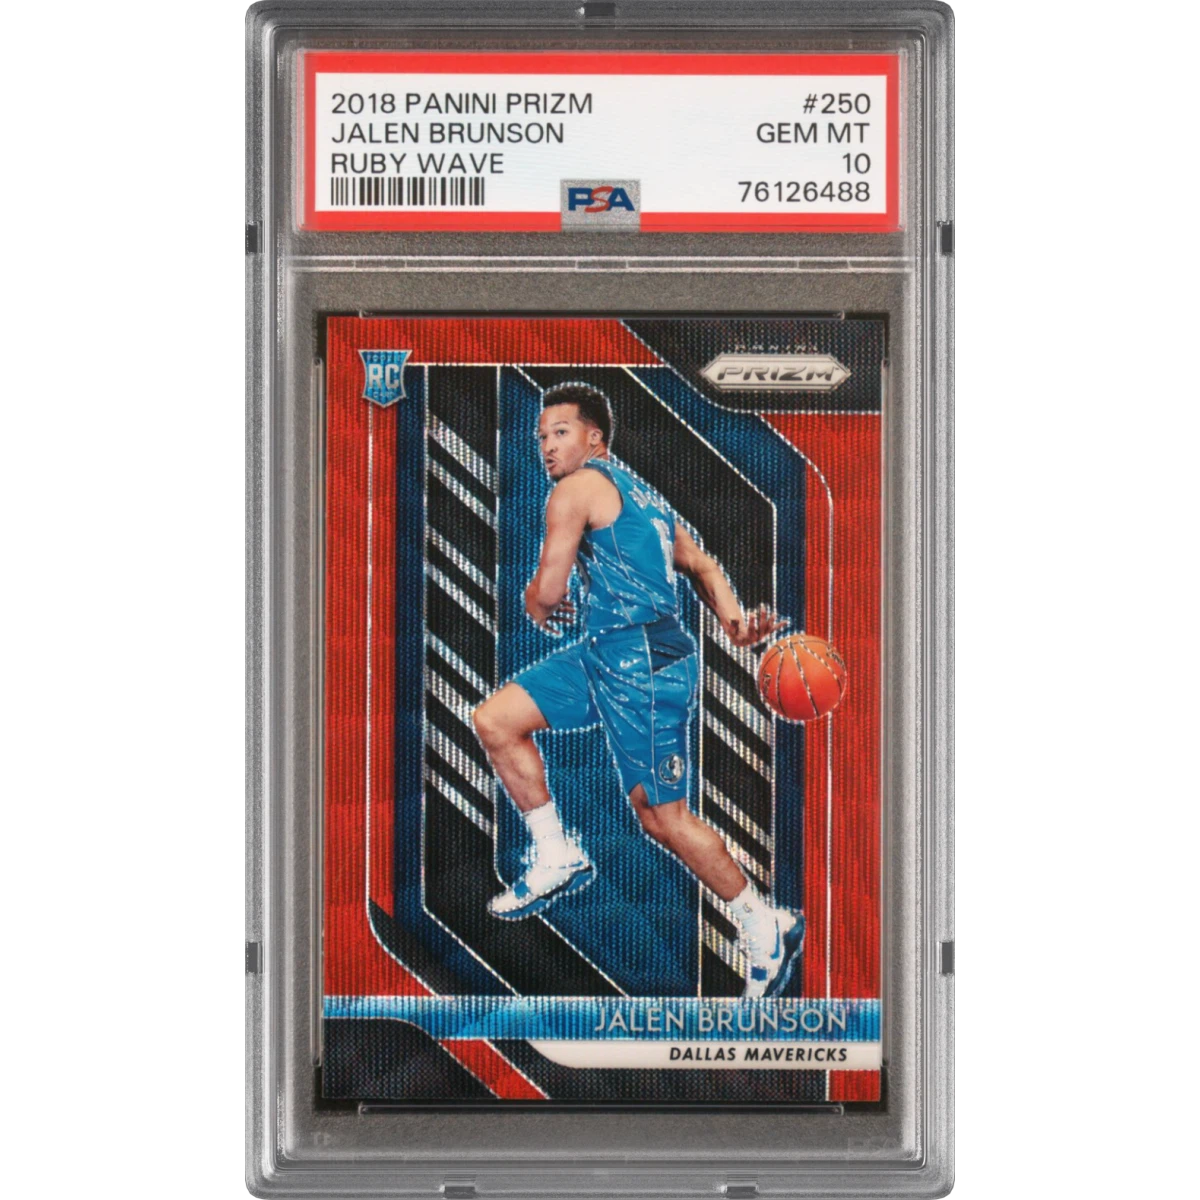 2018 Panini Prizm #250 Jalen Brunson - Ruby Wave (PSA 10 GEM MINT)$618.0049d ago
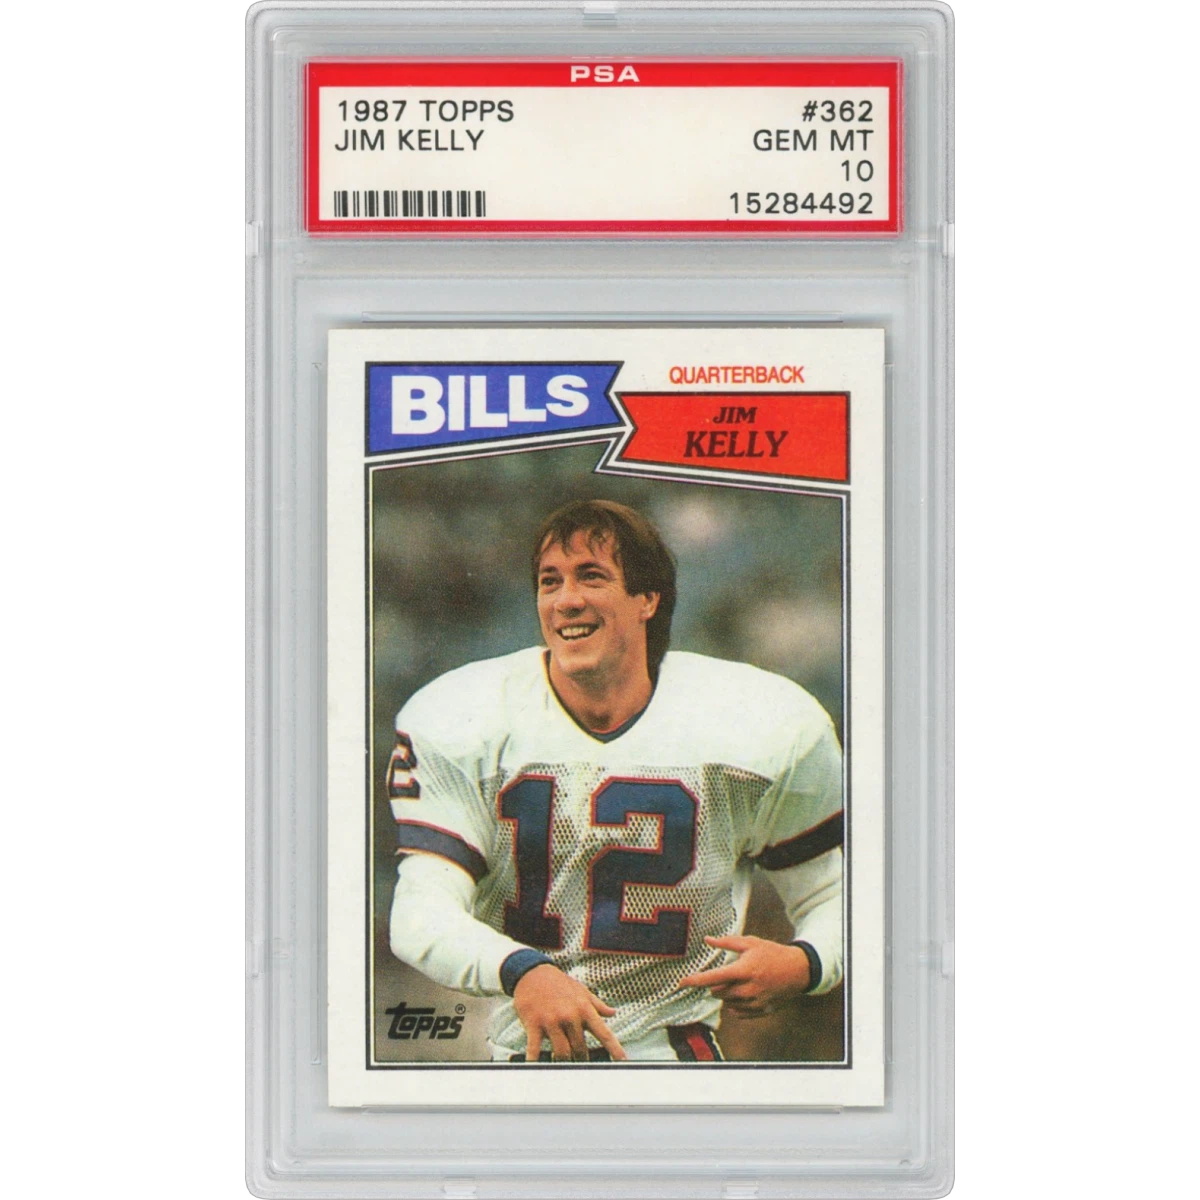 1987 Topps #362 Jim Kelly (PSA 10 GEM MINT)$560.6049d ago
- 2017 Topps Chrome Update #HMT50 Aaron Judge - X-Fractor (PSA 10 GEM MINT)$2,660.0049d ago
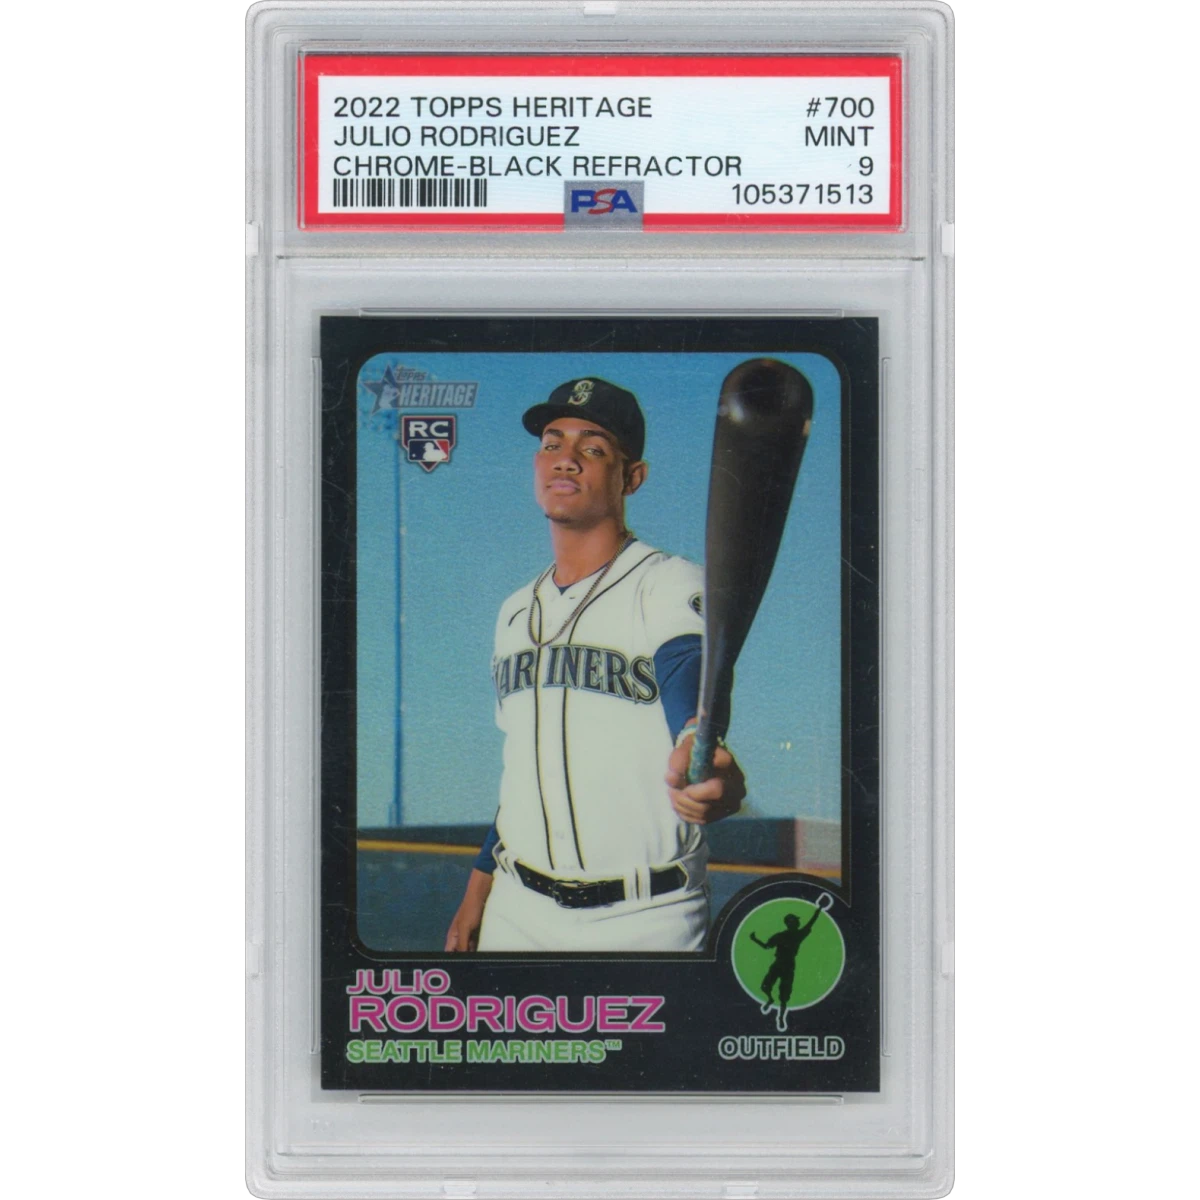 2022 Topps Heritage #700 Julio Rodriguez - Chrome-Black Refractor (PSA 9 MINT)$649.0049d ago
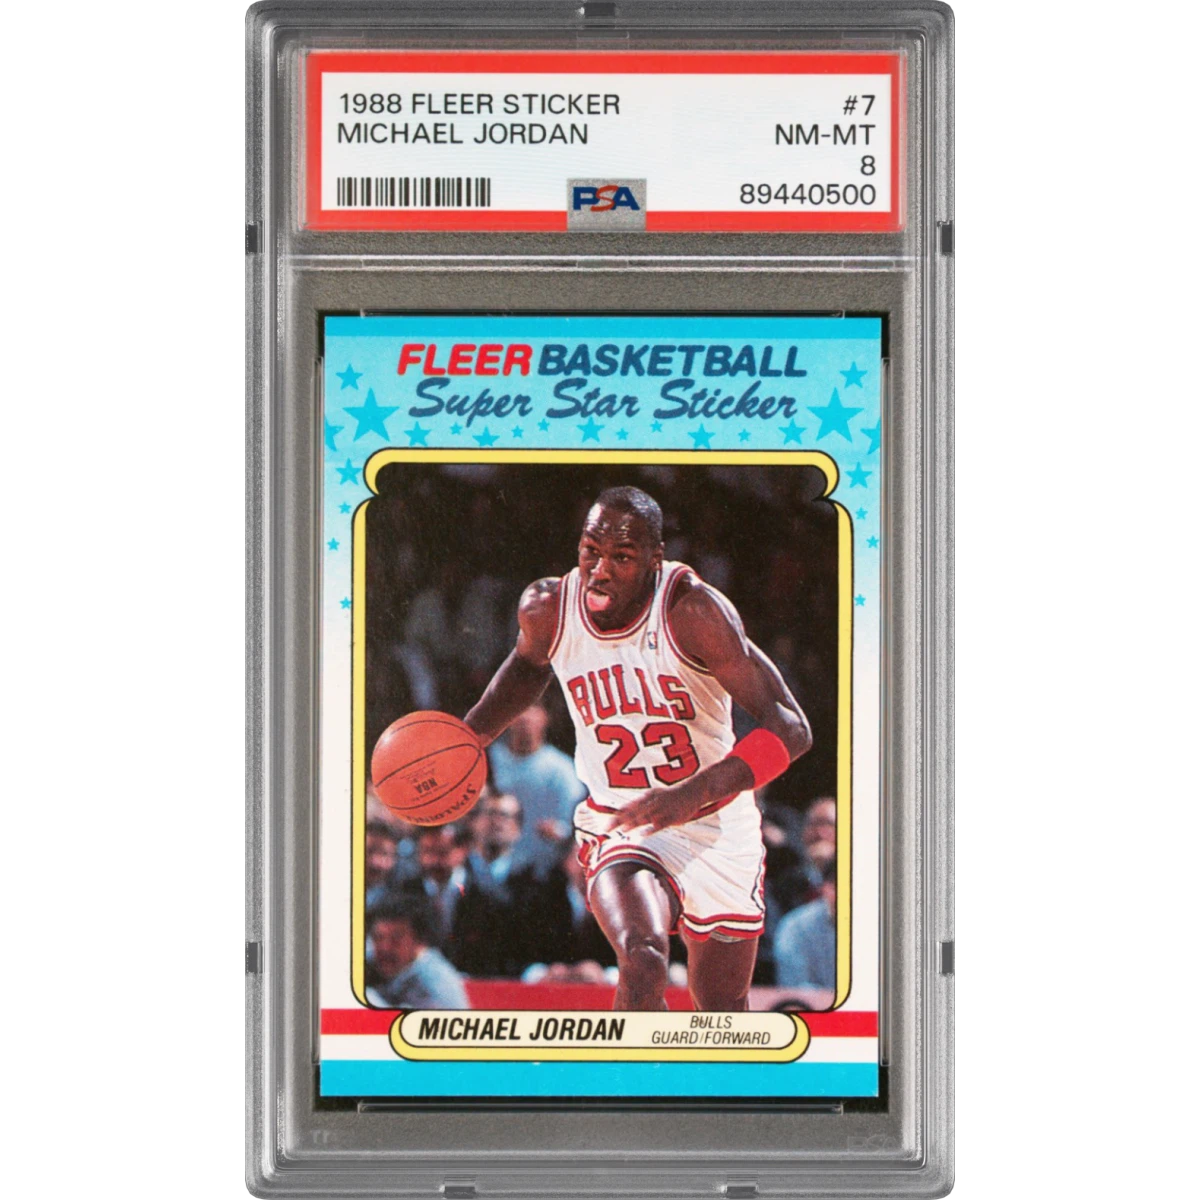 1988 Fleer Sticker #7 Michael Jordan (PSA 8 NM-MT)$619.4049d ago
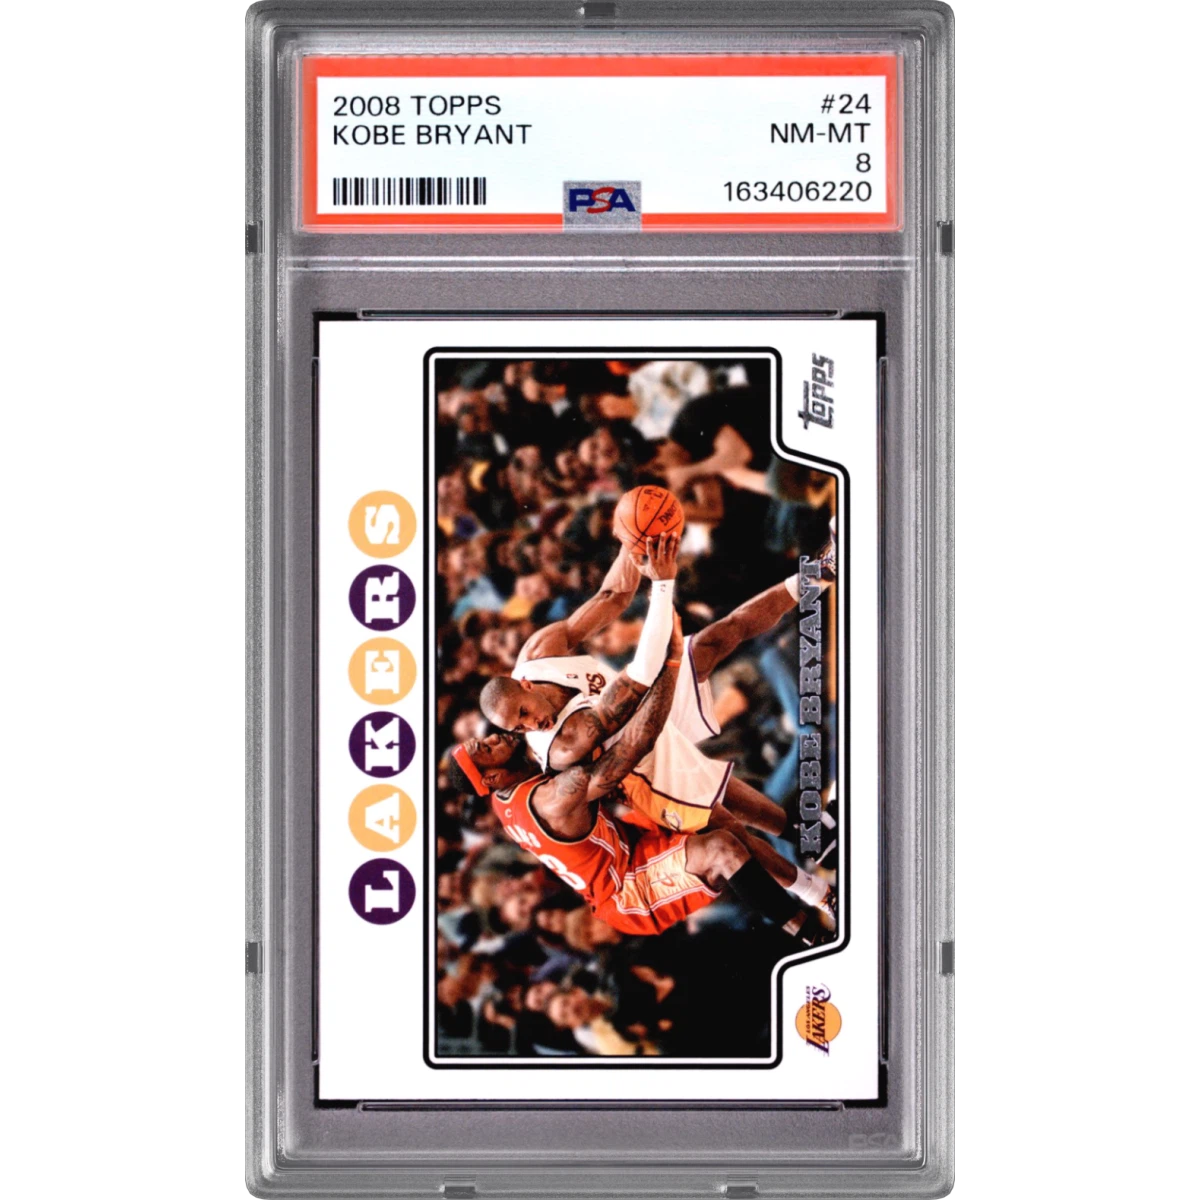 2008 Topps #24 Kobe Bryant (PSA 8 NM-MT)$520.8049d ago
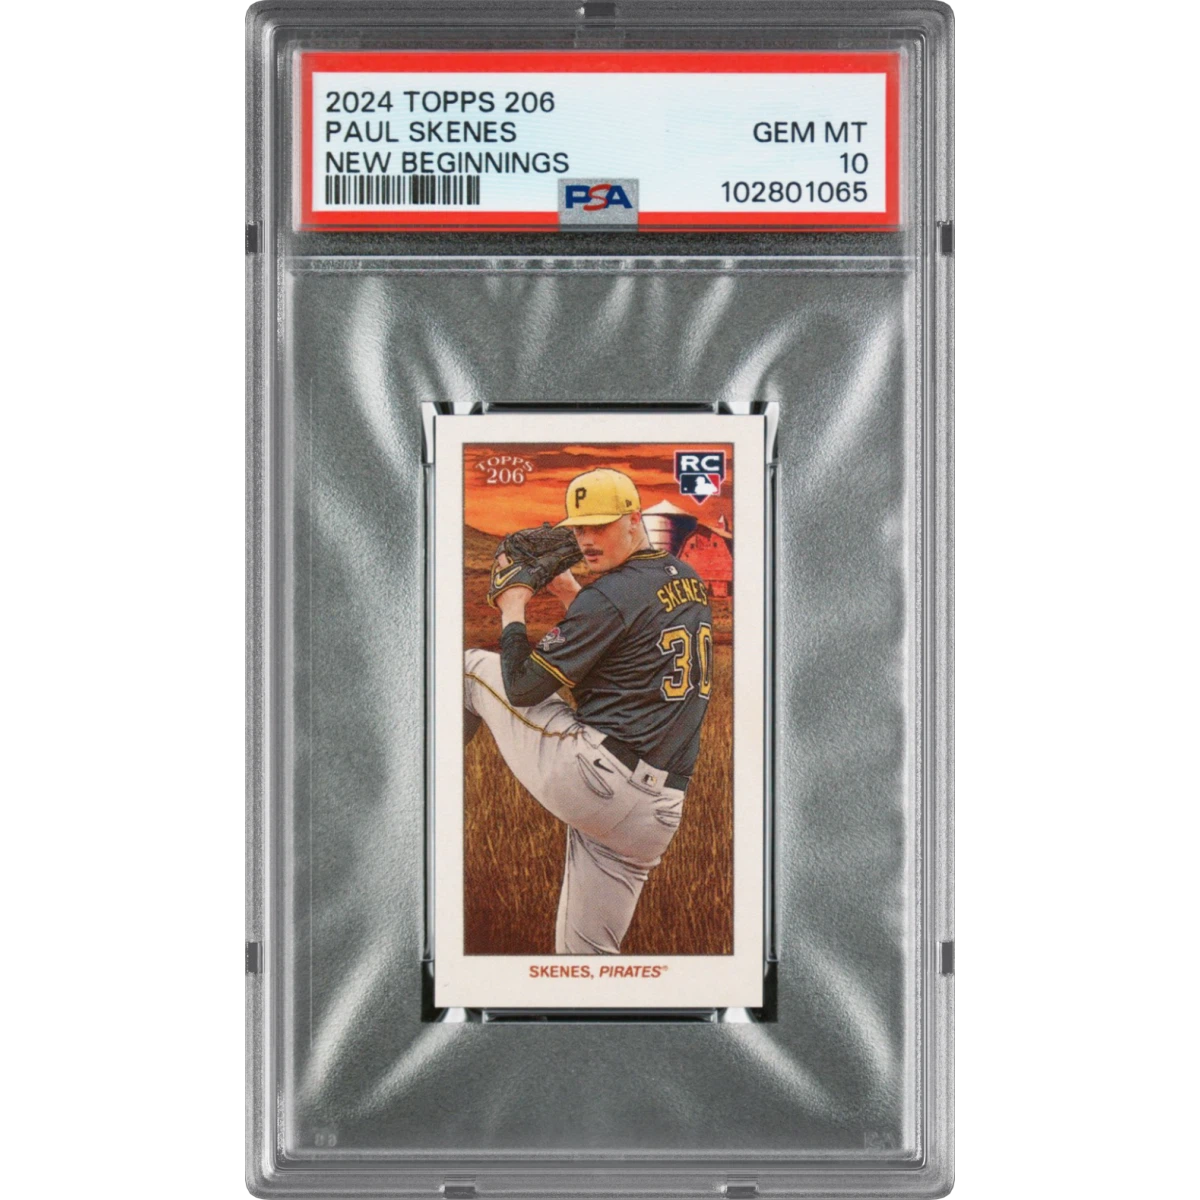 2024 Topps 206 New Beginnings Paul Skenes (PSA 10 GEM MINT)$381.0049d ago
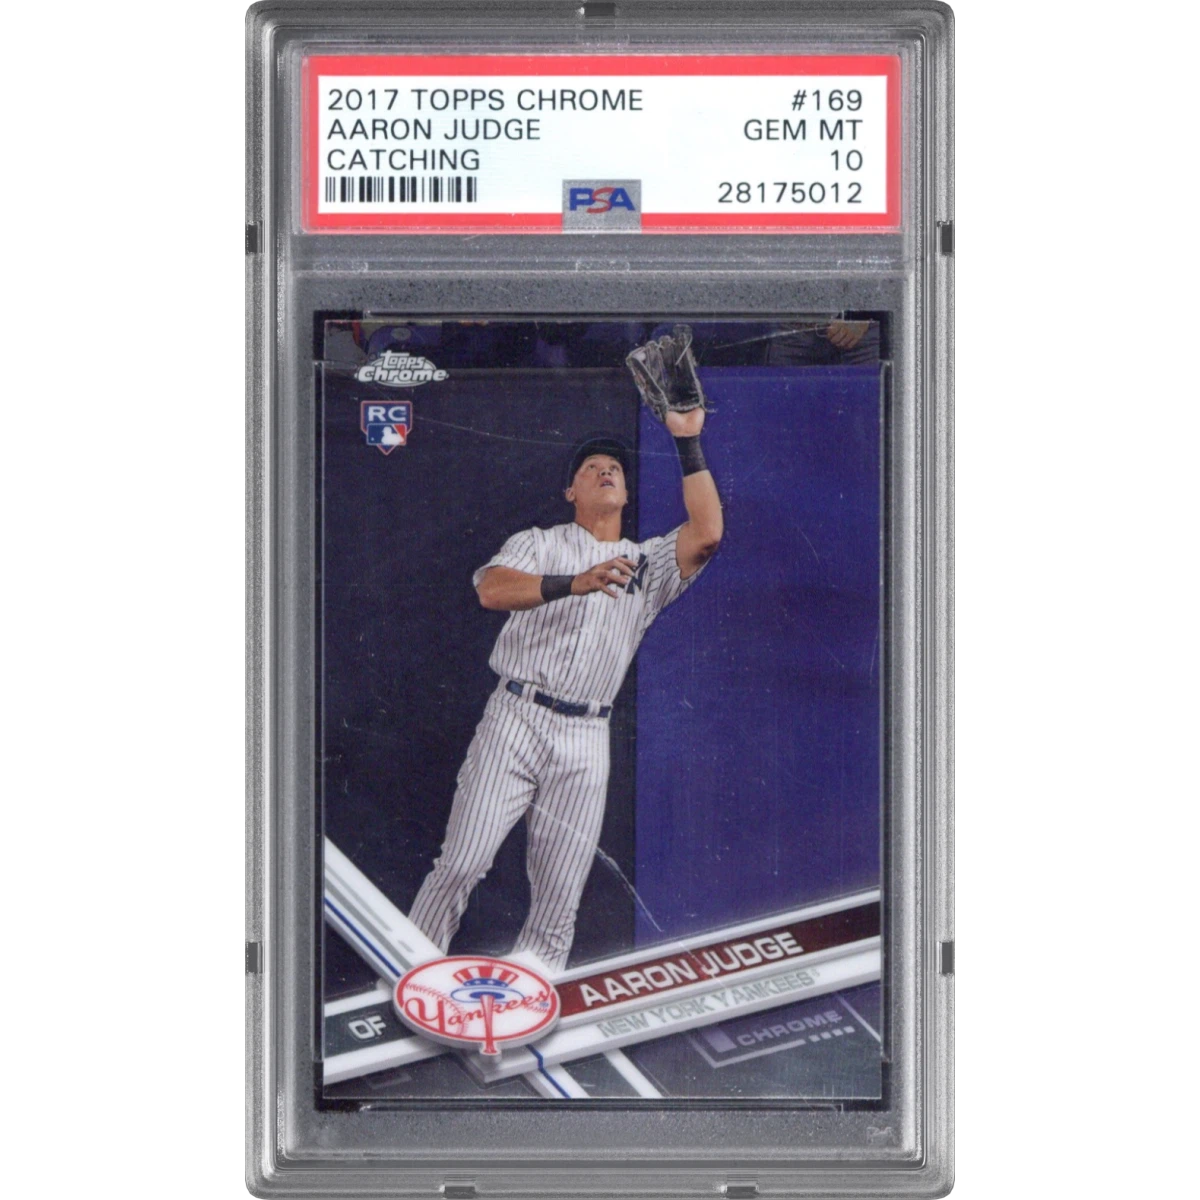 2017 Topps Chrome #169 Aaron Judge (PSA 10 GEM MINT)$395.8050d ago
- 2023-24 Panini Megacracks Laliga EA Sports #108BIS Lamine Yamal (PSA 8 NM-MT)$857.9050d ago
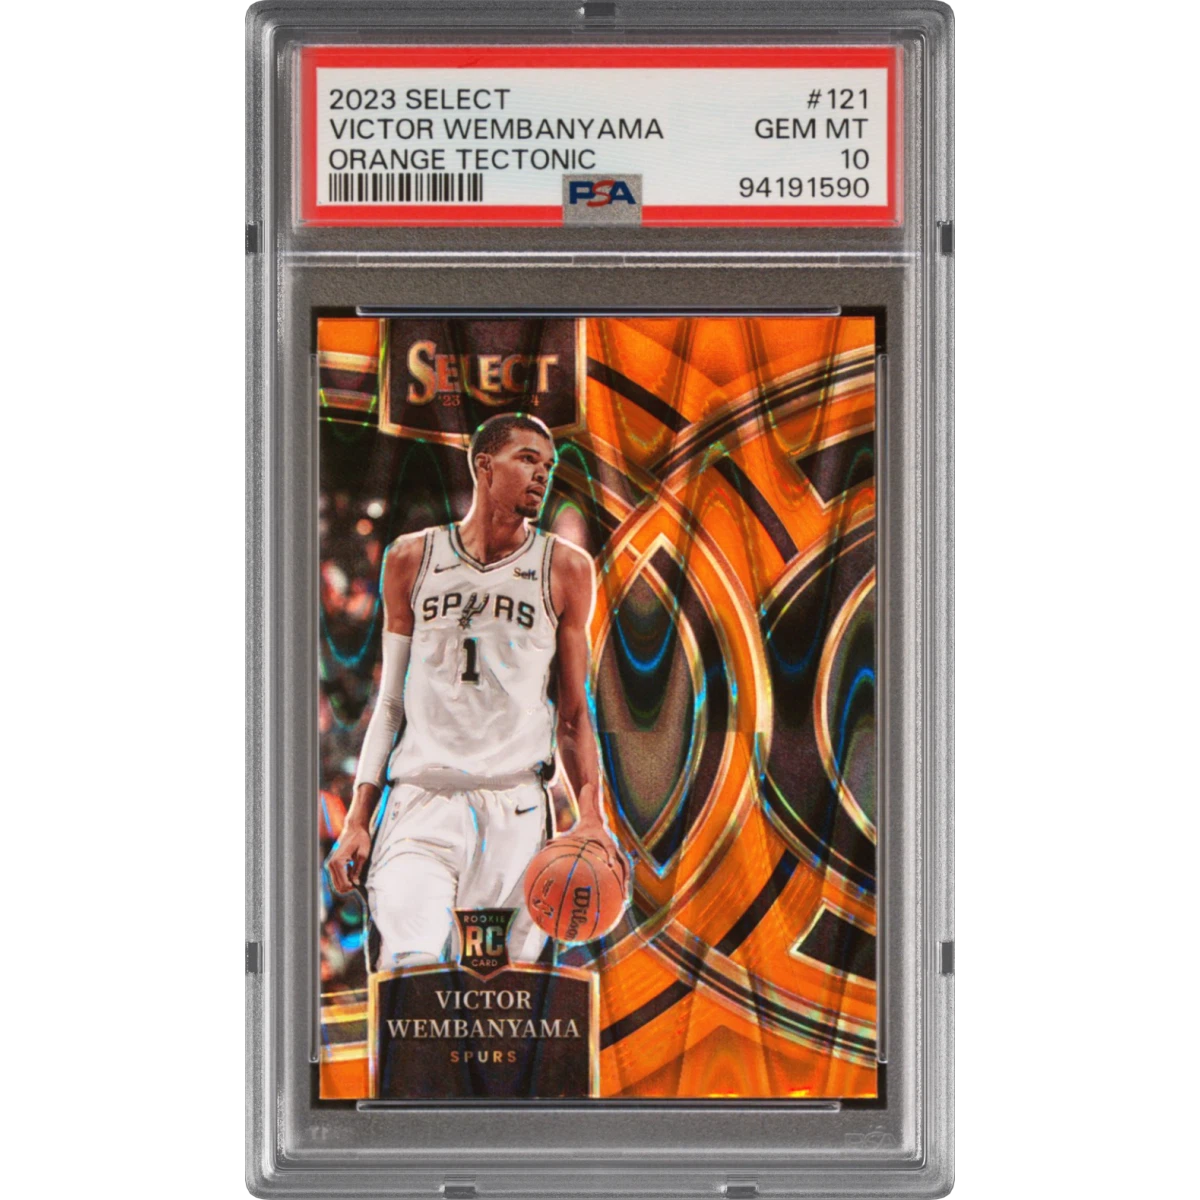 2023 Panini Select #121 Victor Wembanyama - Orange Tectonic (PSA 10 GEM MINT)$385.0050d ago
- Free shows the latest 25 pulls. Pro unlocks the full history + CSV export →
Compare Sports Inferno with other Basketball packs
Same math, same methodology — cash-out ratios after each pack's own buyback, so the comparison is apples to apples.
- Sports Cosmic PackEV $8,554SET PACK PRICE
- Basketball Mythic Pack0.629x cash-out · EV $3,717 · hit rate 20.0%HOUSE EDGE
- Basketball Legend Pack0.645x cash-out · EV $1,907 · hit rate 11.1%HOUSE EDGE
- Basketball Diamond Pack0.902x cash-out · EV $1,066 · hit rate 42.3%HOUSE EDGE
- Wildcard Diamond PackEV $894SET PACK PRICE
- Sports Diamond PackEV $971SET PACK PRICE
Understand these numbers
Every figure on this page — EV, EV ratio, hit rate, dilution — is defined once and computed the same way for every pack.