
Shipwreck
Wildcard Platinum Pack
Wildcard Platinum Pack is a $500 Courtyard Shipwreck mystery pack with a calibrated expected value of $456.07, worth $410.51 at its observed 90% buyback — a cash-out ratio of 0.821x (0.912x at sticker FMV), so it currently returns less than its price on the average rip once the buyback haircut is taken. 23.9% of 46 indexed pulls met or beat the pack price. Rip Advisor verdict: SKIP (17/100).
Ranked #58 of 76 ranked packs by cash-out ratio.
This pack is no longer sold on Courtyard — the numbers below are its historical record.
Cash-out ratio
0.821x
$410.51 back on a $500 pack, at this pack's observed 90% buyback. At sticker FMV it is 0.912x.
95% range $353.70–$467.31, clear of the $500 price.
- Calibrated EV
- $456
- Cash-out EV
- $411
- Pack price
- $500
- Typical pull
- $415
- Hit rate
- 23.9%
- Lifetime EV
- $451
- Pulls indexed
- 46
- Last pull
- 4d ago
01 / Rip Advisor
Is Wildcard Platinum Pack worth it right now?
- Cash-out EV is $411 on a $500 pack (-17.9% net after the ~90% buyback) — the average rip loses money.
- Cash-out EV is $410.51, and the sample is precise enough to place it below the $500.00 price: the 95% range is $353.70 to $467.31, which does not include the price.
- The typical pull (median) is $415 — most rips return less than the pack price; the EV is carried by rare chase cards.
- Recent pulls are averaging 8.9% below where they were 7 days ago. That is what the last week returned, not a reading of what is left — Courtyard publishes no inventory. A drop this size is consistent with the better cards having been pulled, and also with an unlucky week.
- 23.9% of pulls meet or beat the pack price, across 46 indexed pulls.
Downside · bottom-quartile rip
−$169
1 in 4 rips returns ≤ $331 cash — covering 66% of the price.
Upside · top-decile rip
+$30
1 in 10 rips returns ≥ $530 cash. Both figures use the observed buyback ratio.
Verdict is computed transparently from indexed pulls: cash-out ROI, median pull, 7-day trend, hit rate, and sample size. Redemption shipping (typically $16+) is not included — cards worth less than a few times the shipping cost are usually better instant-sold than shipped. Not financial advice.
02 / Pool signals
What's happening in the Wildcard Platinum Pack pool
Recent pulls run 9% below the lifetime average — the observed pool is weakening.
Recent pulls run 9% below the lifetime average — the observed pool is weakening.
Pro adds the Pool Health score and chase-removal impact.
Not observable: packs remaining, value remaining, and which chases are still in the pool — Courtyard publishes a pull feed, not inventory. We label those unavailable rather than estimate them. Everything above is computed from indexed pulls and EV snapshots; thin or stale data pulls the score toward neutral. Formula
Chase tracker
chase tier ≥ $2,500 · confidence 83%No chase-tier pulls (≥ $2500) observed in the last 30 days.
Removals are facts; what's left is not. Each row is a unique graded card observed leaving this pack, so it is no longer in the pool — though a card can return after a buyback, which is why re-listings are flagged. We show no “chance it remains”: Courtyard publishes pulls, not inventory, so that number would be guesswork. Formula
Signal lifetime
SIGNAL Stale · 4 days agoNo new pulls for well past this pack's usual gap (typically 25 h). It may be paused, sold out, or no longer indexed. At the observed pull rate, half the evidence behind this read is replaced in about 47 days.
- Newest pull
- 4 days
- observed
- Pull rate
- 1.0/day
- observed
- Pulls, 7d
- 3
- observed
- Half-life
- Pro
Aged, not predicted. Half-life counts how fast new evidence arrives, measured from real pull timestamps — it is not a forecast of where EV is heading. We publish no EV-drift half-life because our snapshot history is still too short for a regression to mean anything. The seeded placeholder points this note used to warn about have been flagged in the database and excluded from every chart, trend and score, so what you see plotted is observed data. Note the headline EV is decay-weighted, so it reacts to new pulls sooner than this whole-sample horizon implies. Methodology
03 / Contents
What has come out of Wildcard Platinum Pack
By era
Cards seen range from 1882 to 2025.
- Current (2020+)46%$485 avg
- Year not stated29%$462 avg
- Vintage (pre-2000)12%$418 avg
- Modern (2010-2019)10%$407 avg
- Retro (2000-2009)2%$409 avg
Most common sets
Sets these pulls came from.
- Marvel Comics12%$448 avg
- One Piece English Version 1st Anniversary Set5%$513 avg
- Panini Absolute Kaboom! Horizontal5%$414 avg
- Panini Donruss Downtown5%$426 avg
- Topps Update5%$456 avg
- (1652-81)P BOLIVIA 4R (11.80g) Consolacion2%$375 avg
- 1679P V BOLIVIA 4R (6.94g) Consolacion2%$422 avg
- 1742MO MF MEXICO 8R Hollandia2%$584 avg
Cards seen most often
Named on 73% of readable pulls. The rest do not print a card number, and without one the card cannot be told apart from the set name.
- Shohei Ohtani7%$456 avg
- Brian Thomas Jr.3%$439 avg
- Brook3%$396 avg
- Cam Ward3%$414 avg
- Cooper Flagg3%$367 avg
- Darth Vader3%$594 avg
- Doctor Strange3%$524 avg
- G.I. Joe, A Real American Hero3%$355 avg
What comes out
Not every pull is a graded single.
- Graded cards61%$465 avg
- Graded coins24%$459 avg
- Graded comics12%$448 avg
- Sealed booster packs2%$434 avg
Built from the 41 indexed pulls of this pack so far — a record of what has come out, not a promise about what is left. 5 names could not be read and are excluded.
04 / Floor safety
Wildcard Platinum Pack floor safety & buyback reality
In Wildcard Platinum Pack, the top 2% of pulls account for 4% of all pulled value — low dilution. Value is spread fairly evenly across the pool, so the average is close to what a typical rip returns. The observed instant-offer ratio is 91% of FMV, which is the cash number every verdict on this page already uses.
Floor safety
low dilution4% of everything this pack has paid out came from just the top 2% of pulls. Value is spread broadly across pulls, so the average sits closer to the typical rip here than it does on a top-heavy pack. It still sits above the median — check both.
Buyback reality
90.0% of FMV observedAcross 45 indexed pulls that carry a recorded bid, a $100 FMV pull cashes out around $90 if you instant-sell — better than the platform's 84.6%. This is the figure every verdict on the site multiplies by.
Measured per card rather than per dollar the ratio is 91.2% — higher because cheaper cards draw proportionally better offers. That one describes a single card; the 90.0% above describes a basket, which is what an expected value needs.
Holding, listing, or physically redeeming can beat the instant offer — but redemption shipping (typically $16+) eats small wins.
Net exit value
45 paired pulls · 98% bid coverage · confidence 83%Instant-selling the average (mean) pull here returns $408.29 — $45.31 below sticker FMV (10.0% haircut). That figure is the average of bids we actually recorded, not the platform rate applied blind.
Pro compares all three exits side by side, with the redemption breakeven and the value-by-value haircut curve for this pack.
Bids are recorded, resale is not. Instant-buyback figures are real offers captured at index time and can move. Redemption shipping starts near $16 in the US, is higher internationally, and is charged per shipment — batching pulls lowers it. We publish no resale estimate, liquidity score, or time-to-sell, because no such data is available to us. How buyback works
05 / Observed odds
Wildcard Platinum Pack odds — observed, not posted
Across 46 indexed pulls, 23.9% returned at least the $500 pack price and 0.0% returned double or more; the single best recorded pull is $891.
- Under $250
- $250 – $500
- $500 – $1,000 · beats the pack
- $1,000 – $2,500 · big hit
- $2,500+ · chase
Observed across 46 indexed pulls — what actually came out of this pack, independent of the posted odds. The 48h column shows tier drift: a falling green tier means fewer of the good cards have come out lately — which may mean they are running out, or may just be a quiet 48 hours.
06 / Simulator
Wildcard Platinum Pack rip simulator
- Cost
- $2,500
- Expected cash-out
- $2,053
- Expected net
- -$447
- ≥1 hit chance
- 74.5%
Recent pool: pulls are weighted so newer ones count for more, the same basis as this pack’s headline, verdict and the budget tool. The 46 pulls behind the hit chance are unweighted either way, and the 90% buyback is applied to both. Averages describe many rips — any single rip can land anywhere on the distribution.
Monte Carlo · 10,000 trials
P(profit) 3.9%
Mean net −$469
Cost $2,500
- Worst 5%
- −$777
- Bottom quartile
- −$642
- Median
- −$508
- Top quartile
- −$330
- Best 5%
- −$39
Bootstrap resampling of 46 observed pulls with the 90% cash-out applied. Every pull is drawn with equal probability, so this is an all-time average: it will sit below the headline whenever the recent pool has run better than the lifetime one, and above it when the reverse is true. It also assumes the pool doesn't change as you rip — for top-heavy packs the downside is understated once the grail leaves. Estimates, not financial advice.
07 / Big hits
Biggest Wildcard Platinum Pack pulls
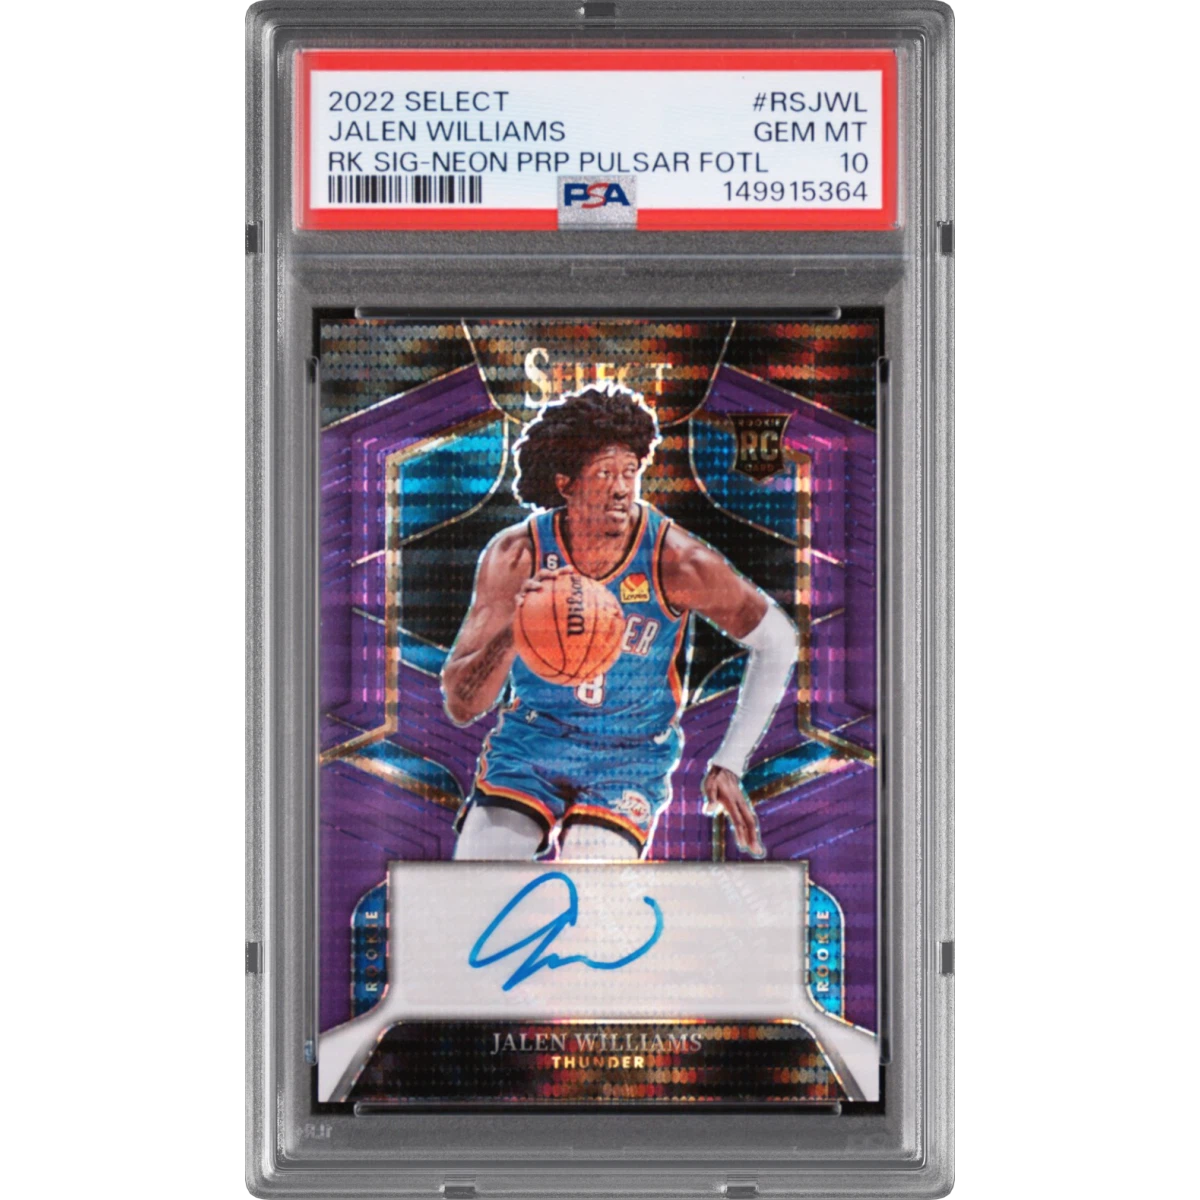
2022 Panini Select Rookie Signatures #RSJWL Jalen Williams - Neon Purple Pulsar Fotl (PSA 10 GEM MINT)
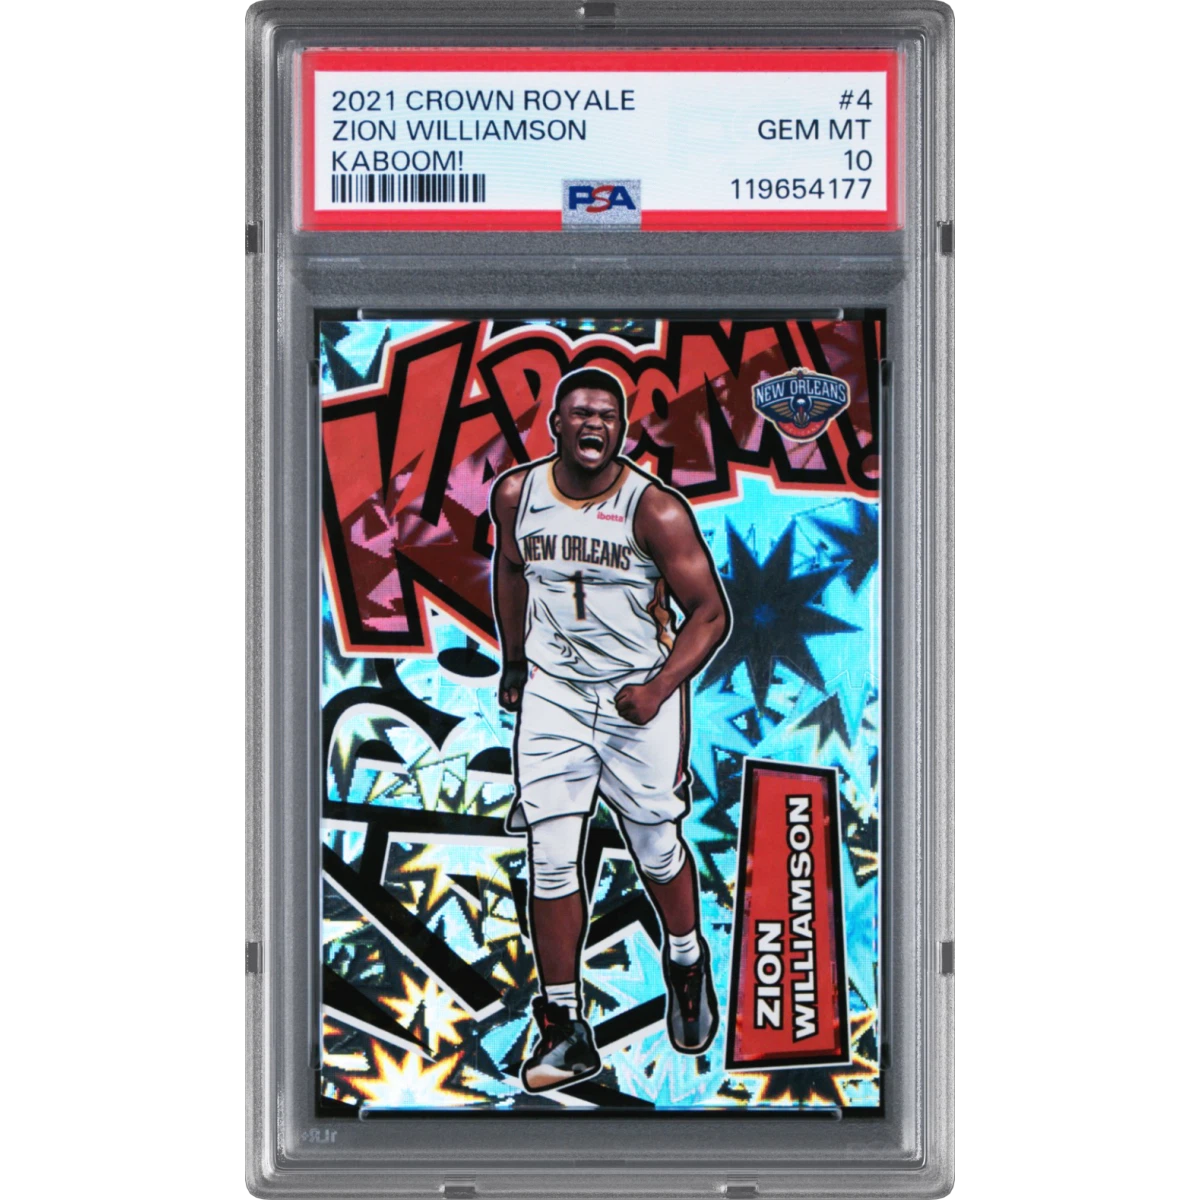
2021 Panini Crown Royale Kaboom! #4 Zion Williamson (PSA 10 GEM MINT)
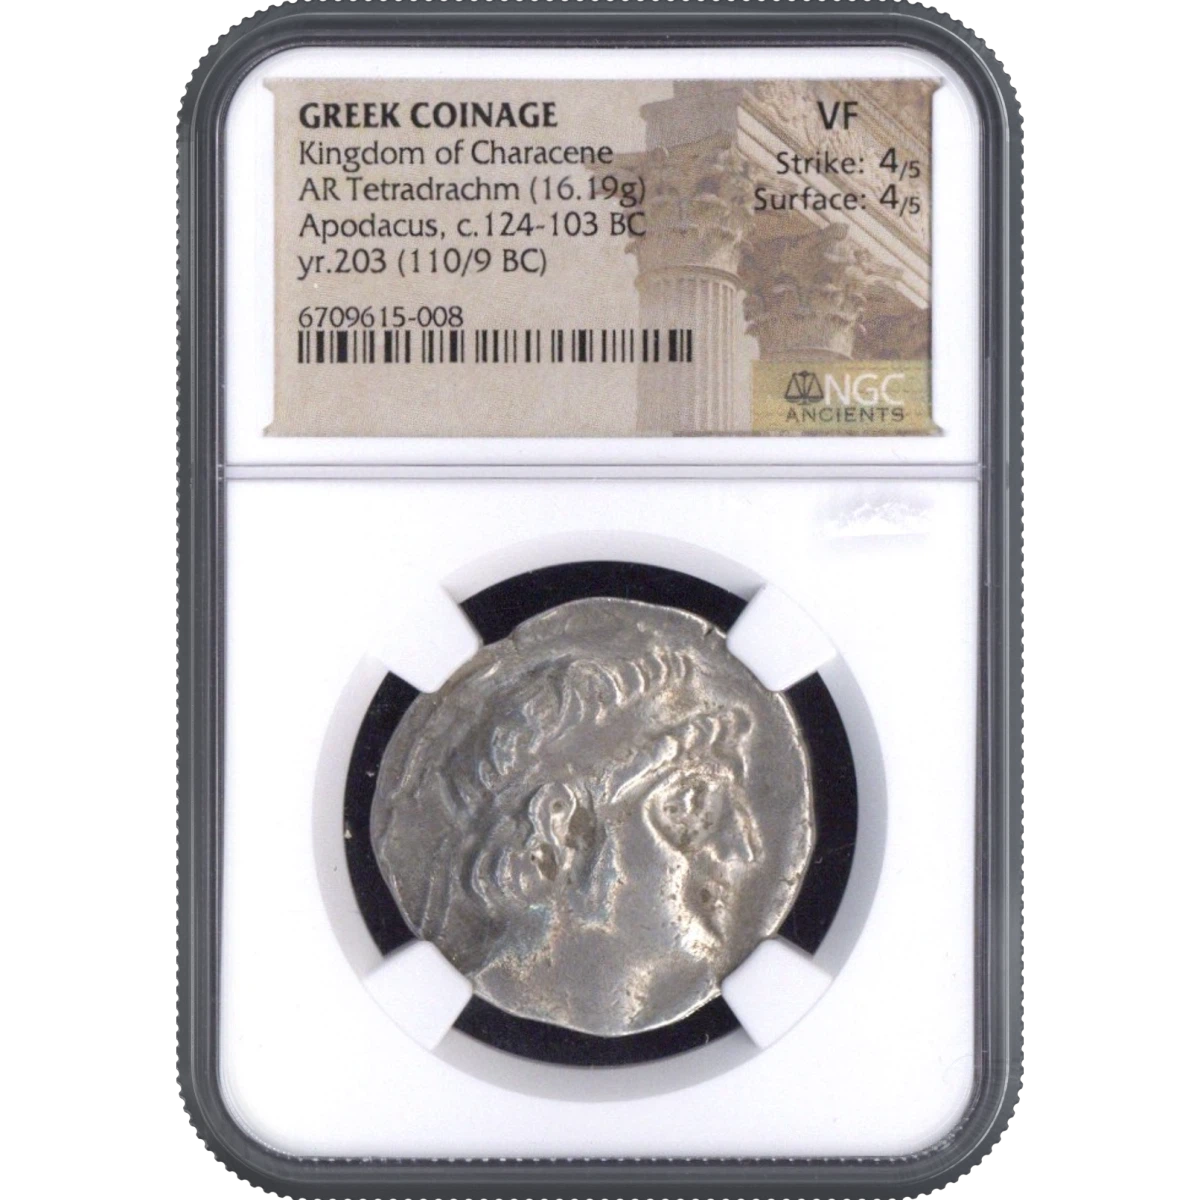
Kingdom of Characene GREEK COINAGE AR Tetradrachm yr.203 (110/9 BC) NGC VF
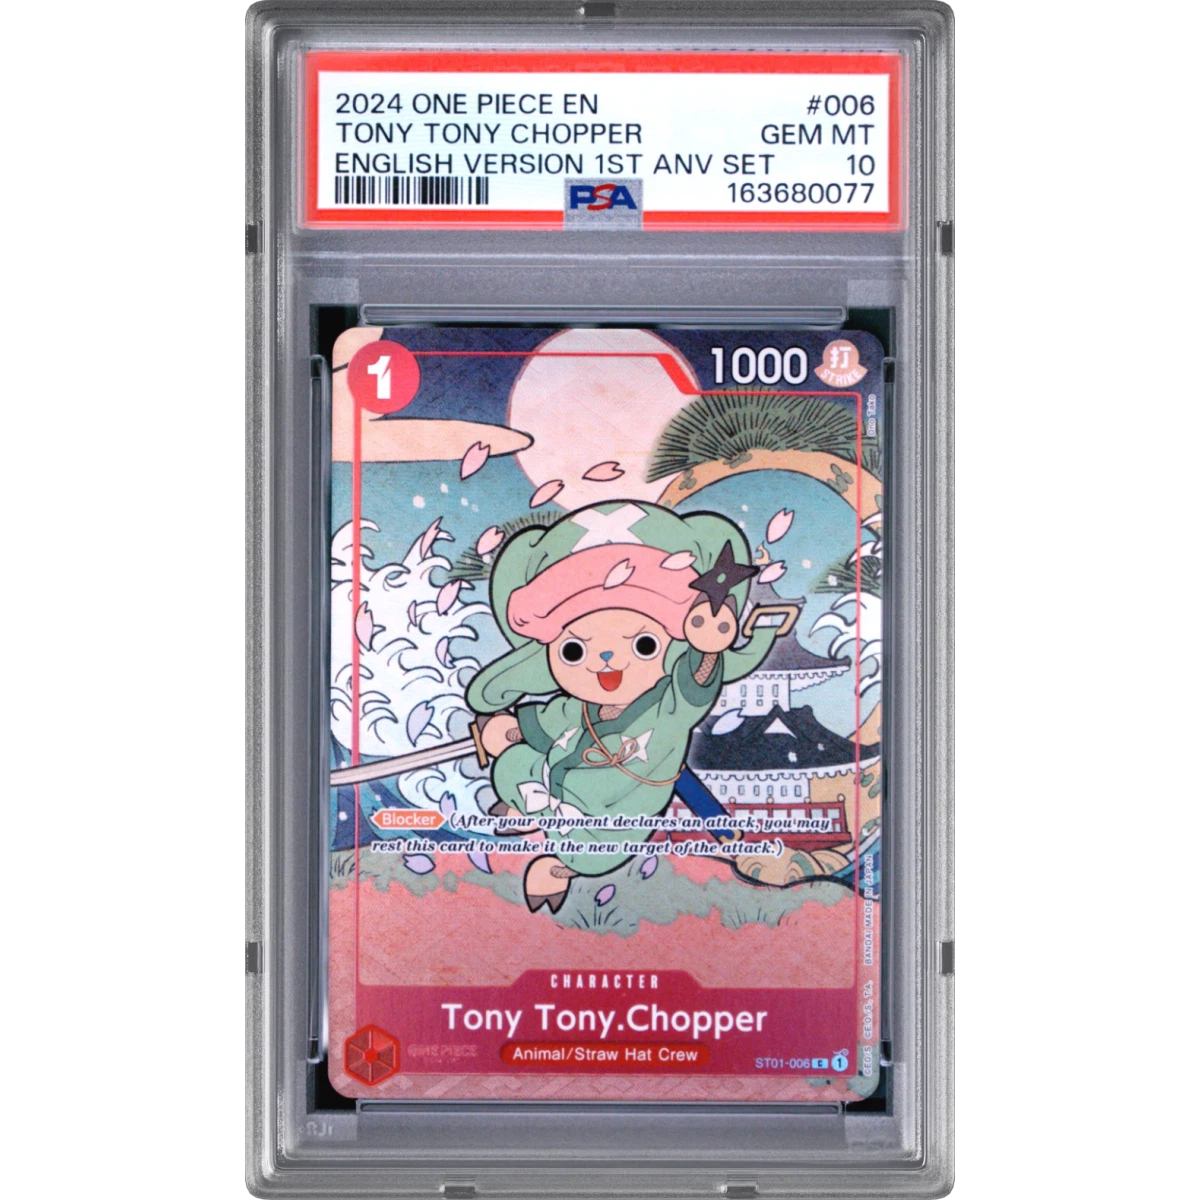
2024 One Piece English Version 1st Anniversary Set #006 Tony Tony Chopper (PSA 10 GEM MINT)
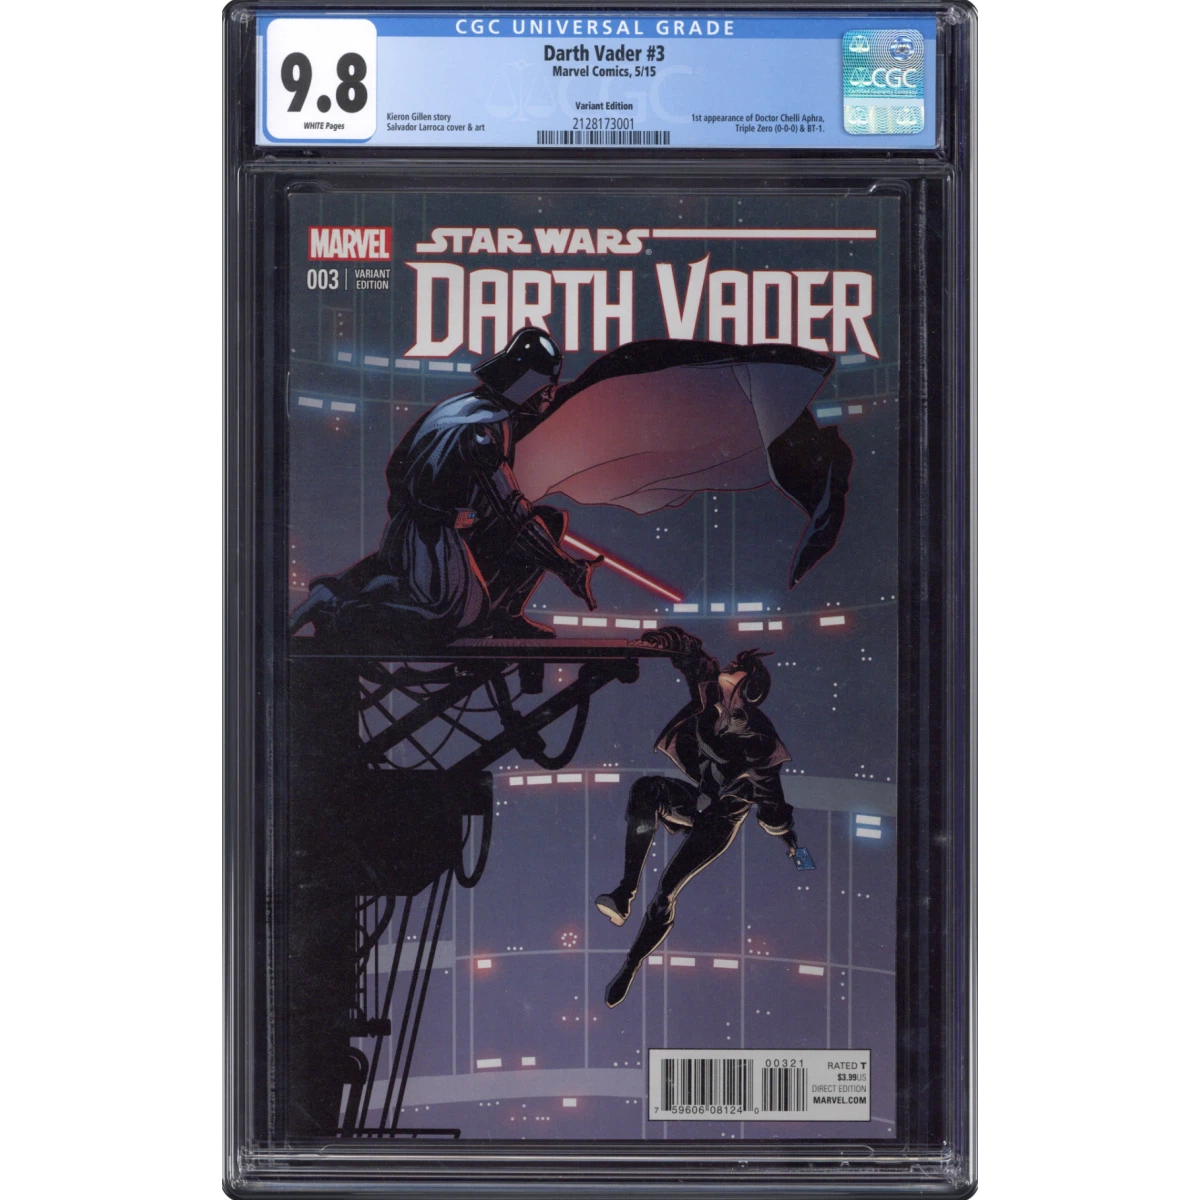
Darth Vader #3 CGC 9.8 White Pages (Marvel Comics, 5/15) - Universal Variant Edition
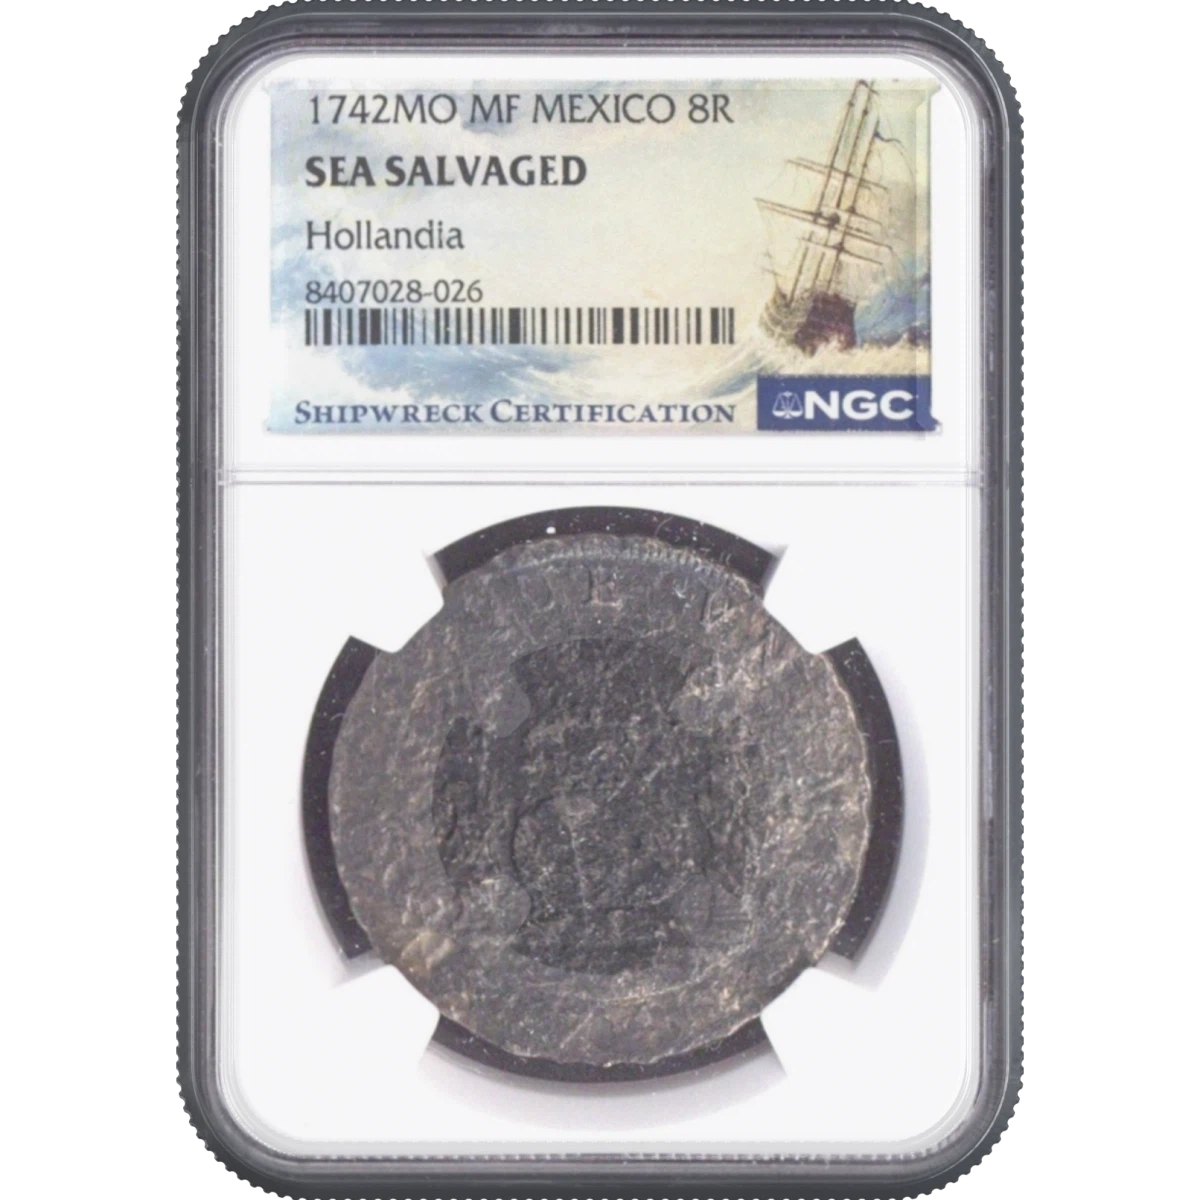
1742MO MF MEXICO 8R Hollandia NGC SEASALVAGED

2020 Panini Prizm #256 Tyrese Maxey - Silver Prizm (PSA 10 GEM MINT)
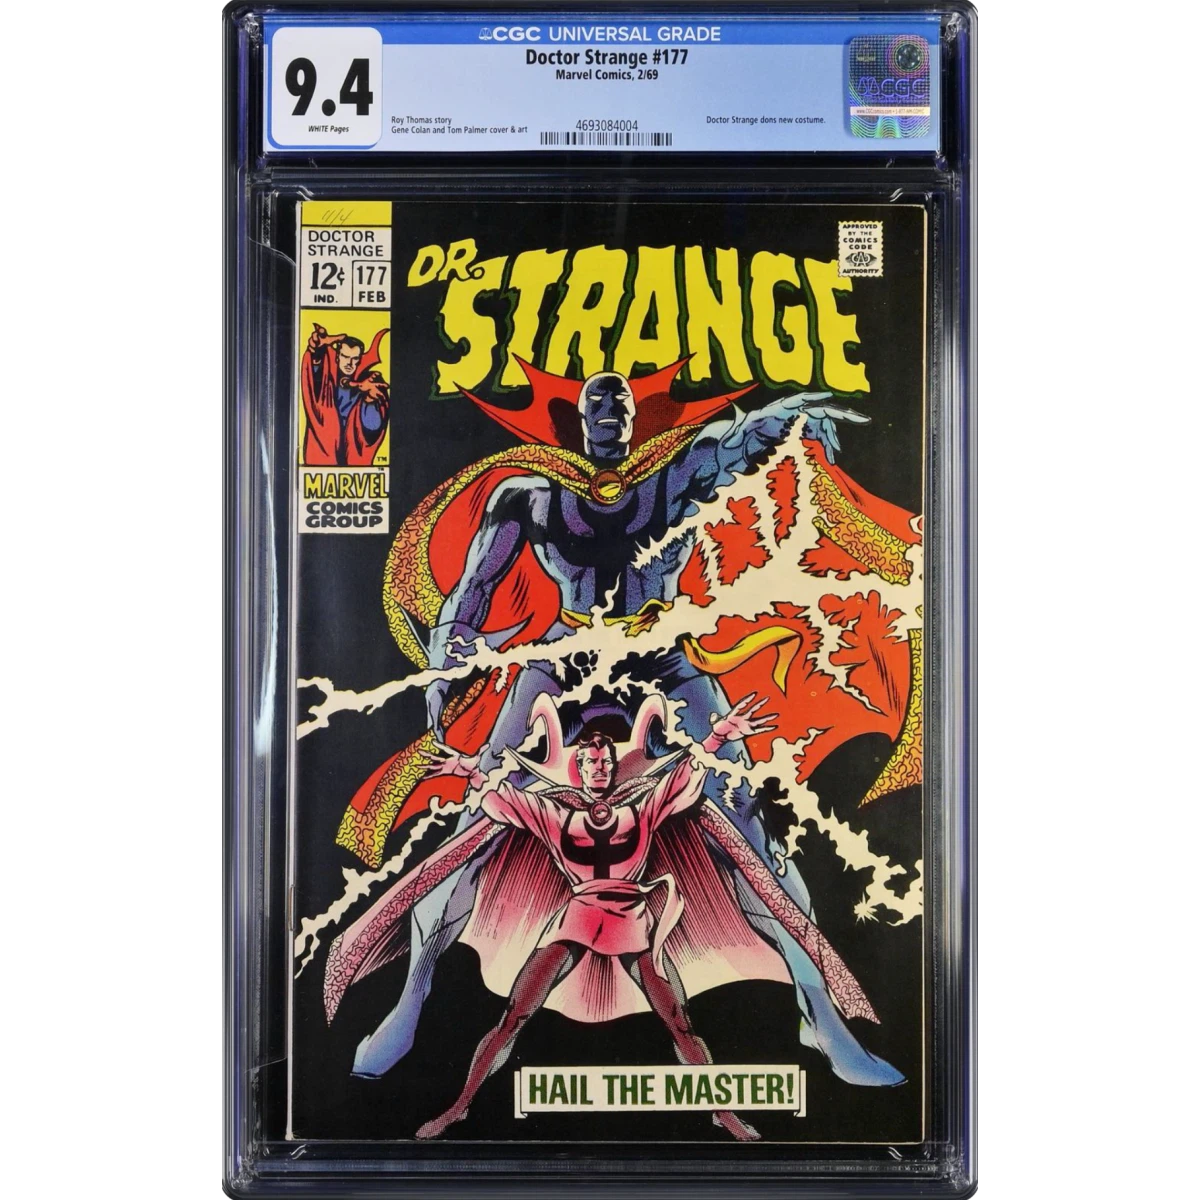
Doctor Strange #177 CGC 9.4 White Pages (Marvel Comics, 2/69) - Universal
08 / EV history
Wildcard Platinum Pack EV over time
Calibrated EV currently sits at $456.07, below the $500 pack price, and has moved down 8.9% over the last 7 days.
Cash-out ratio over time: 577 points from Nov 1 to Nov 7, starting at 0.90x and ending at 0.82x, down overall (-8.9%), ranging between 0.82x and 0.90x.
09 / Quick answers
Wildcard Platinum Pack — quick answers
- Is Wildcard Platinum Pack worth buying right now?
- Our current verdict is SKIP (score 17/100). Cash-out EV is $411 on a $500 pack (-17.9% net after the ~90% buyback) — the average rip loses money.
- What is the EV of Wildcard Platinum Pack?
- The calibrated EV is $456.07 against a pack price of $500.00, with a typical (median) pull of $414.70 across 46 indexed pulls.
- What are the real odds of beating the pack price on Wildcard Platinum Pack?
- 23.9% of indexed pulls met or beat the pack price, and 0.0% returned at least double the price. These are observed odds reconstructed from real pulls, not the posted odds.
- What is the typical pull from Wildcard Platinum Pack?
- The median pull is $414.70 — half of all indexed rips returned less than that. The single best recorded pull is $890.70.
10 / Pull log
Latest Wildcard Platinum Pack pulls
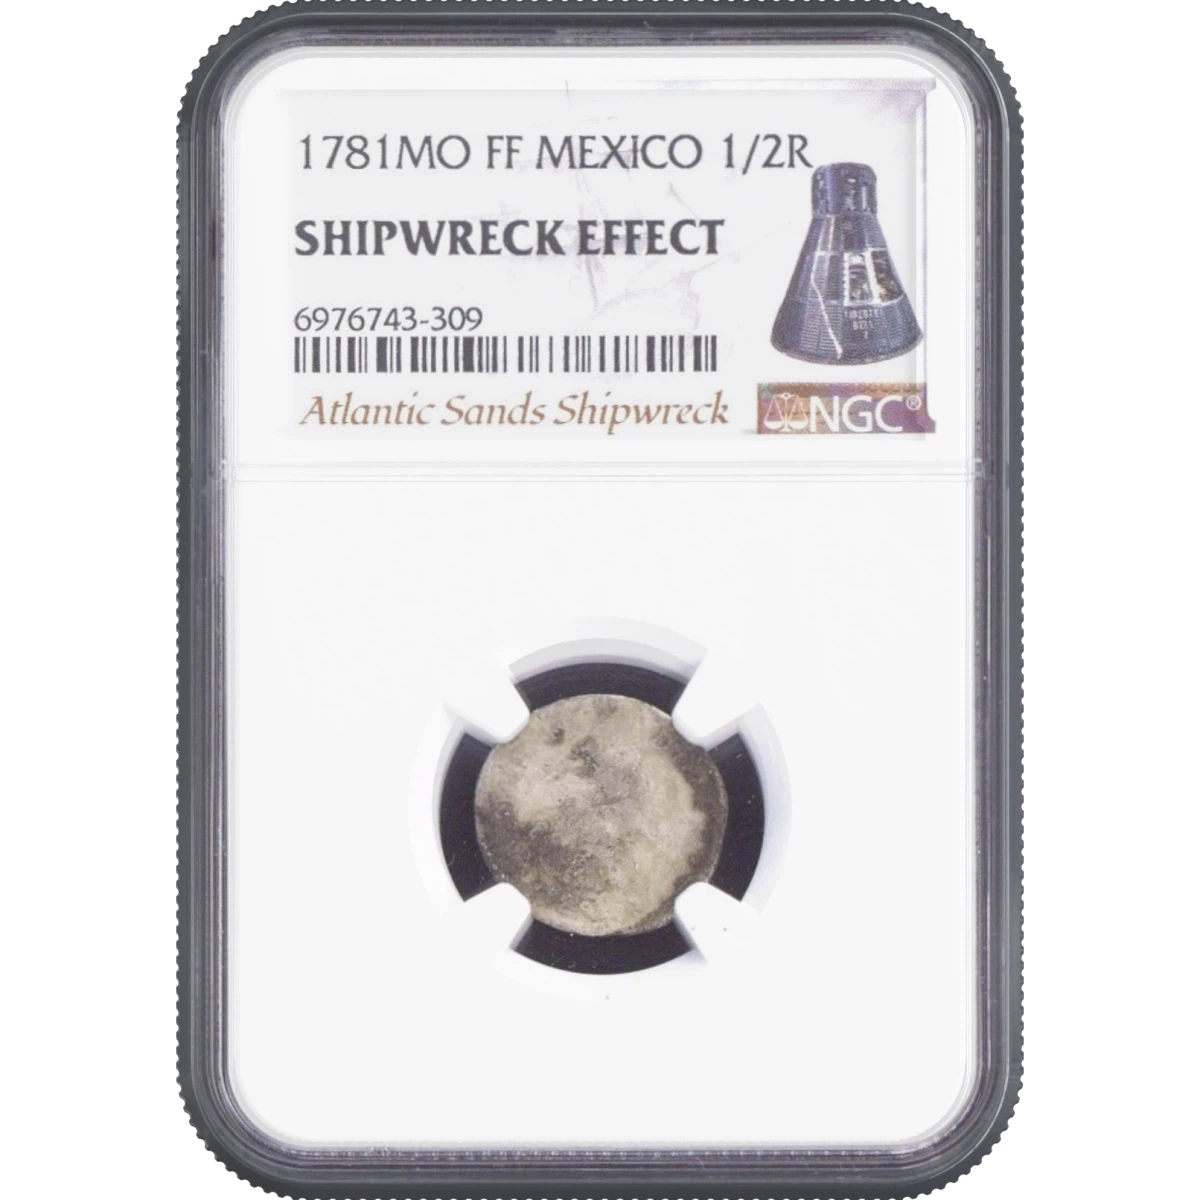 1781MO FF MEXICO 1/2R NGC$350.004d ago
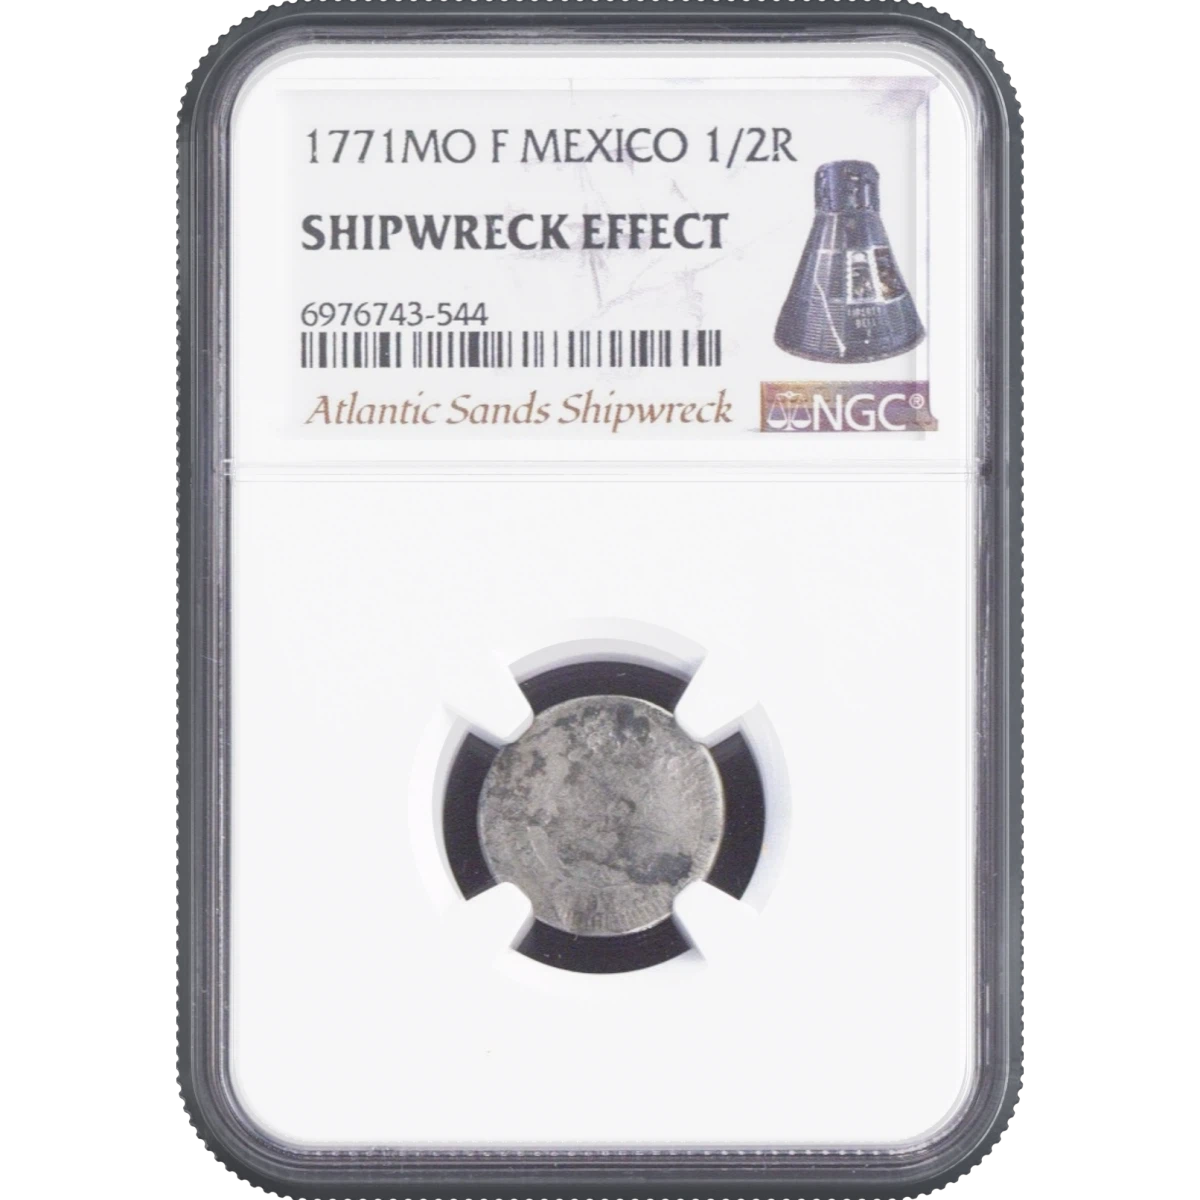 1771MO F MEXICO 1/2R NGC$350.004d ago
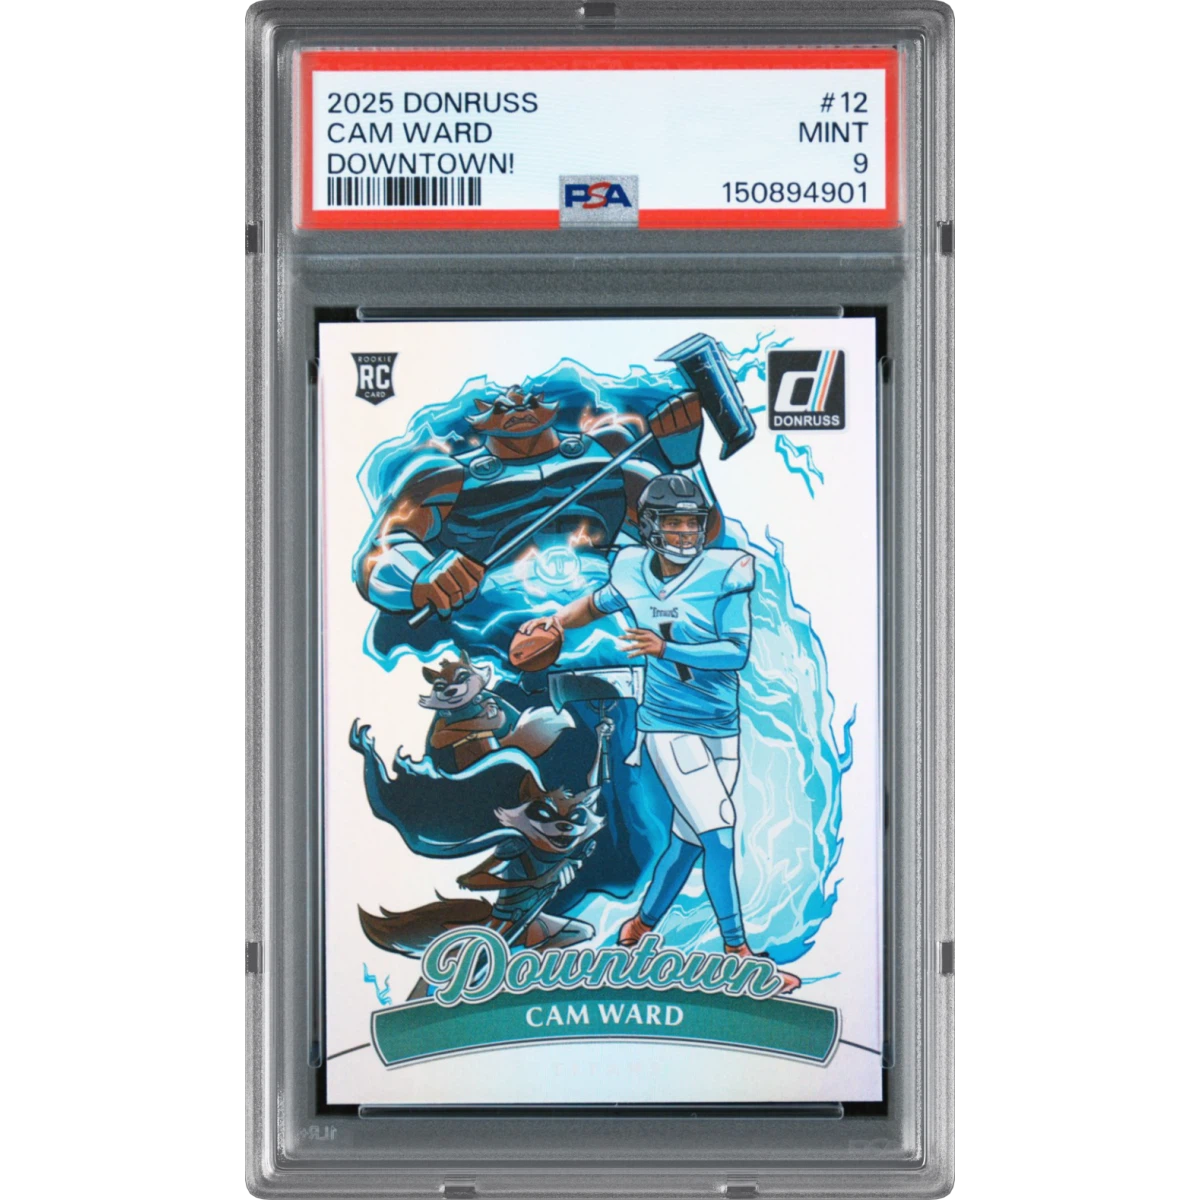 2025 Panini Donruss Downtown #12 Cam Ward (PSA 9 MINT)$414.405d ago
- 1742MO MF MEXICO 8R Hollandia NGC SEASALVAGED$583.808d ago
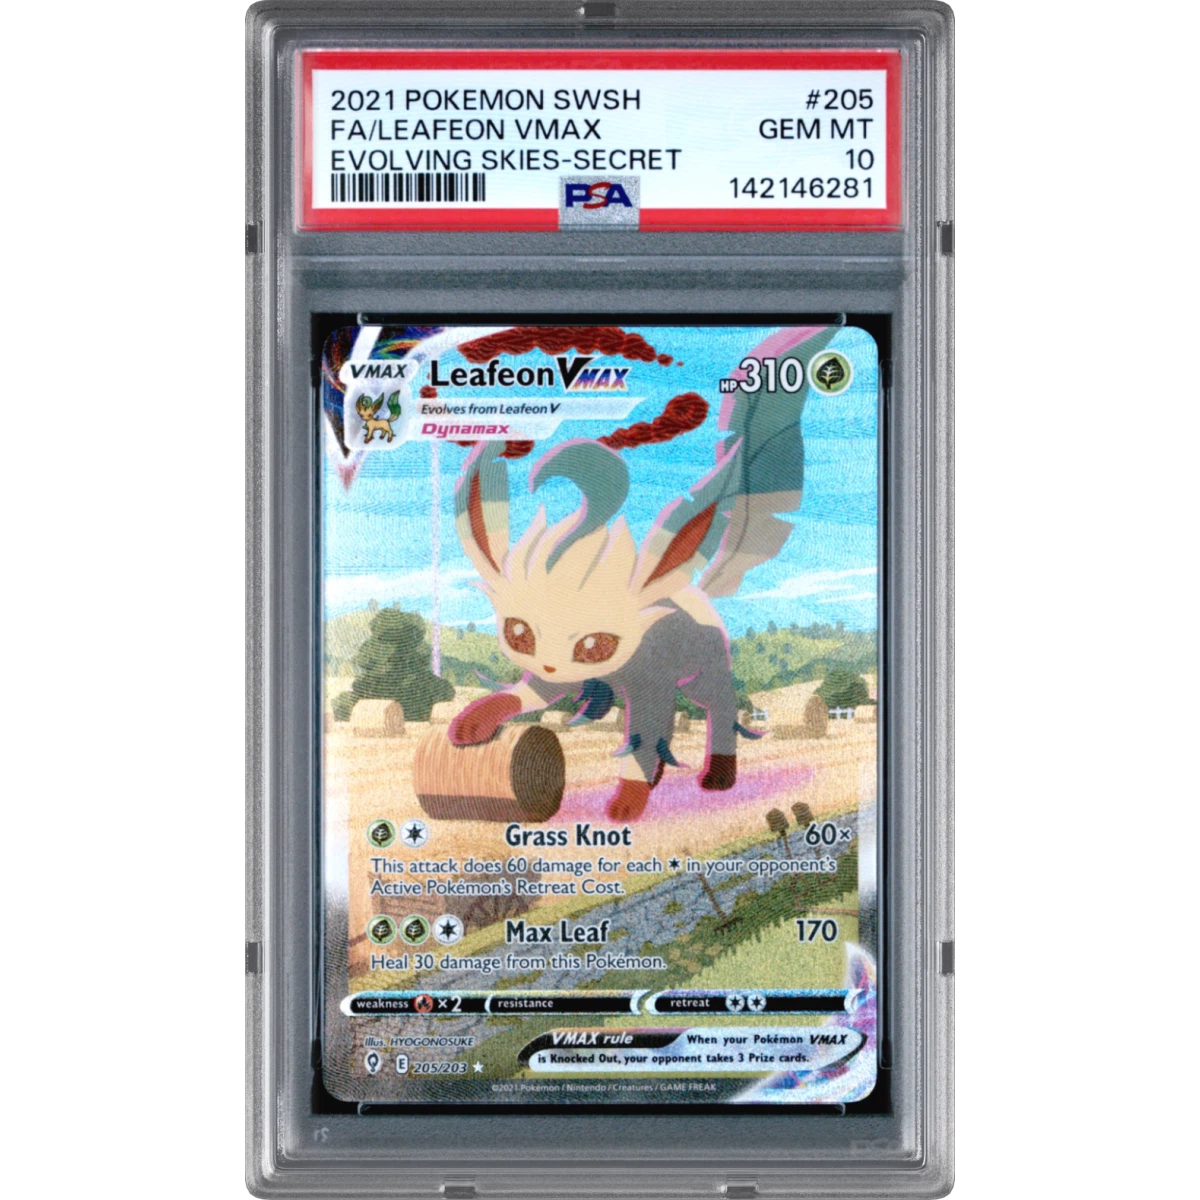 2021 Pokémon Sword & Shield Evolving Skies #205 Leafeon Vmax - Full Art Secret (PSA 10 GEM MINT)$517.508d ago
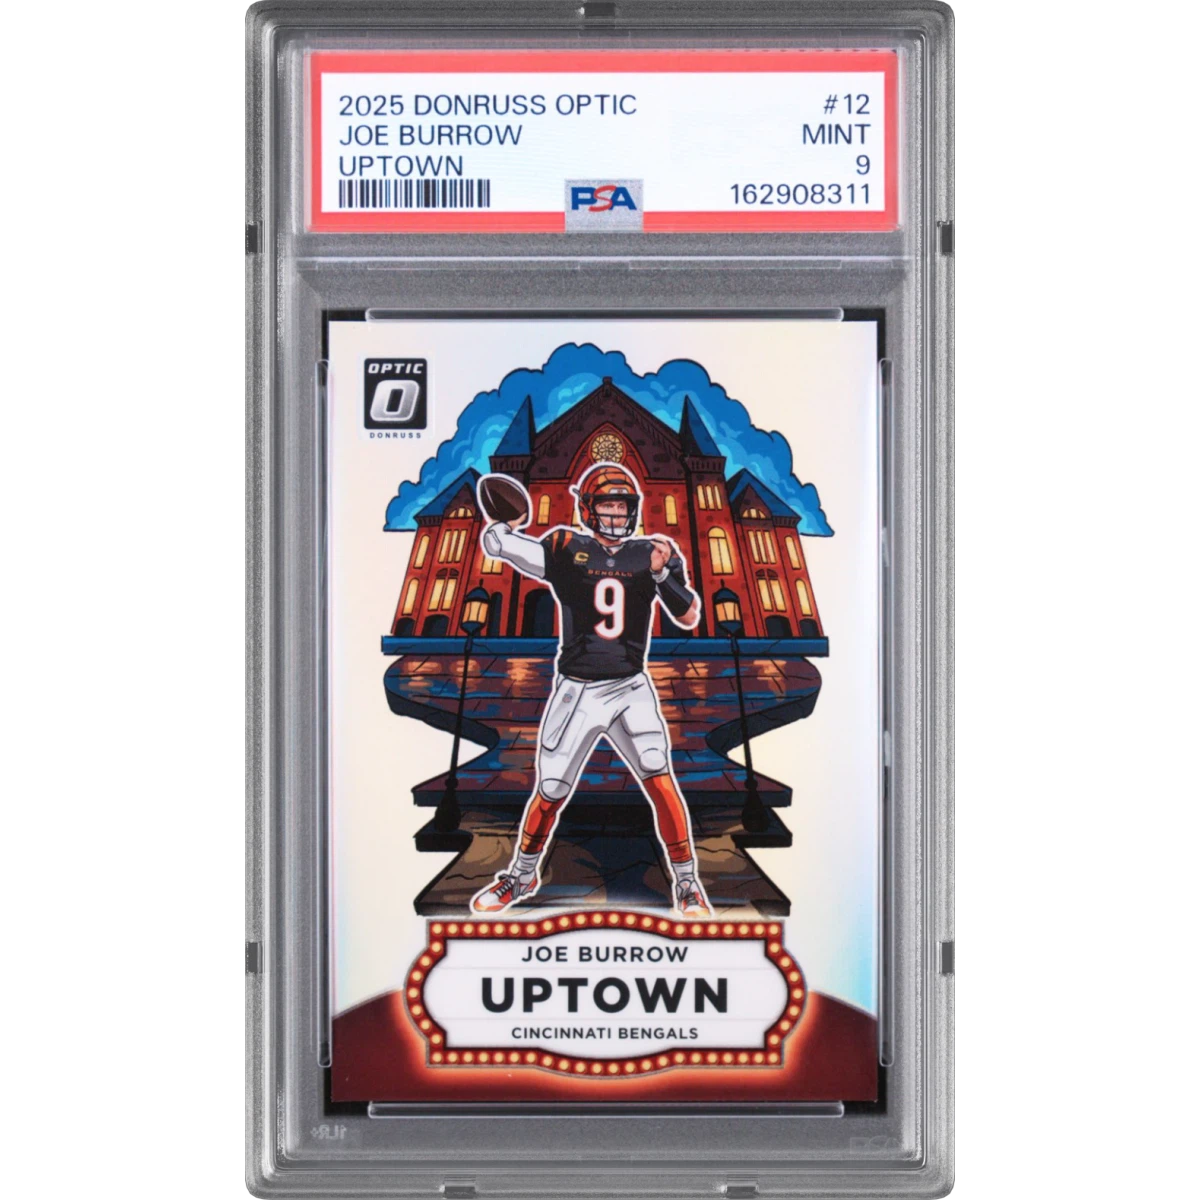 2025 Panini Donruss Optic Uptown #12 Joe Burrow (PSA 9 MINT)$362.709d ago
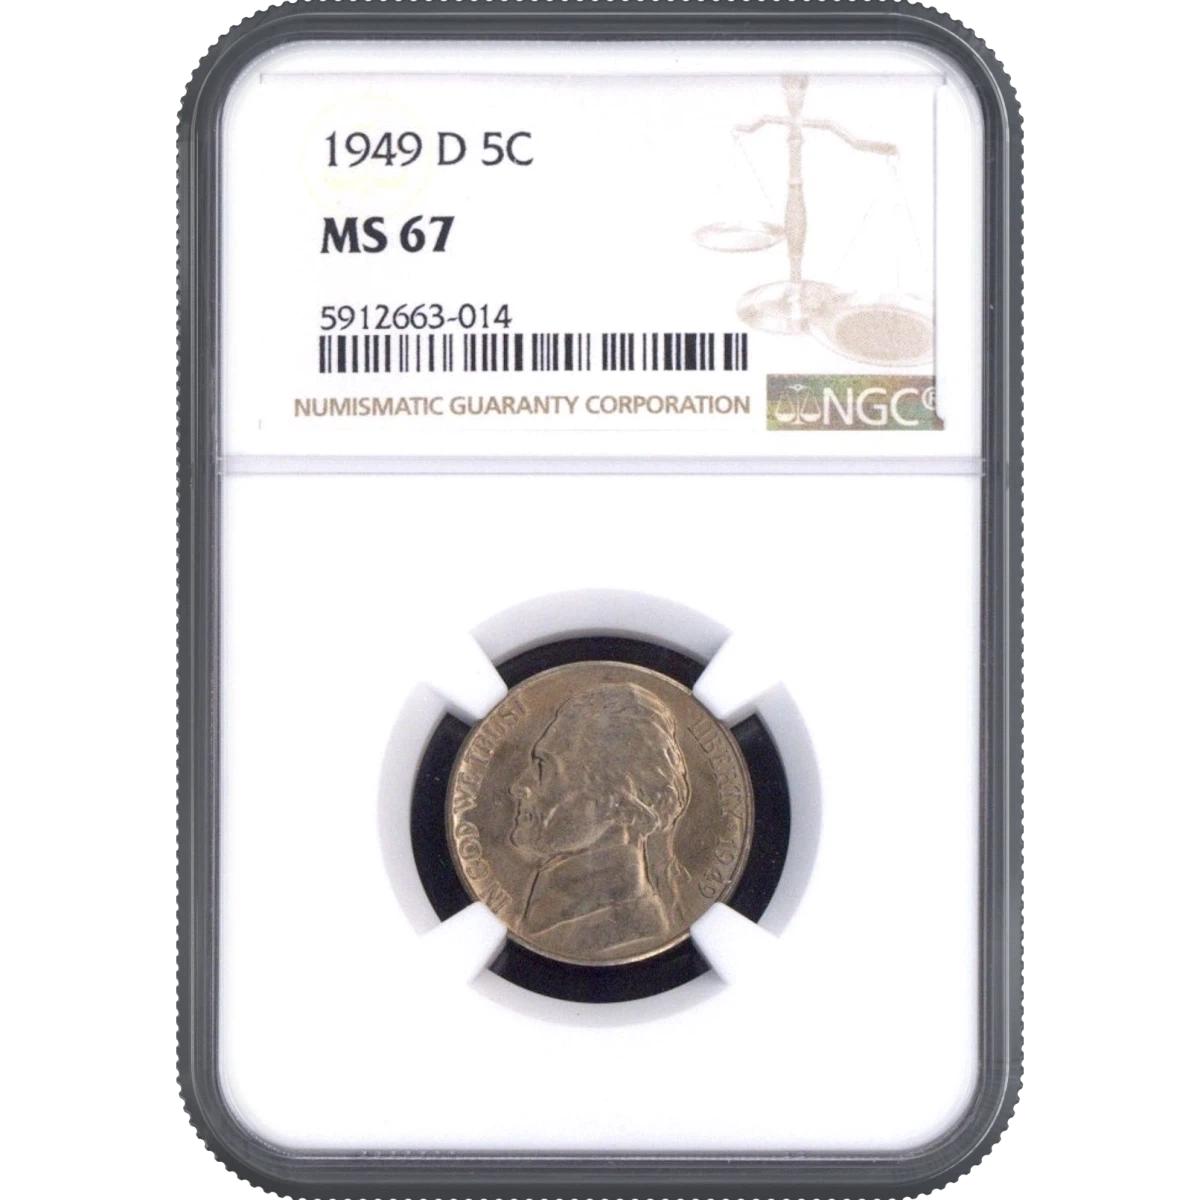 1949-D 5 Cents NGC MS67$462.509d ago
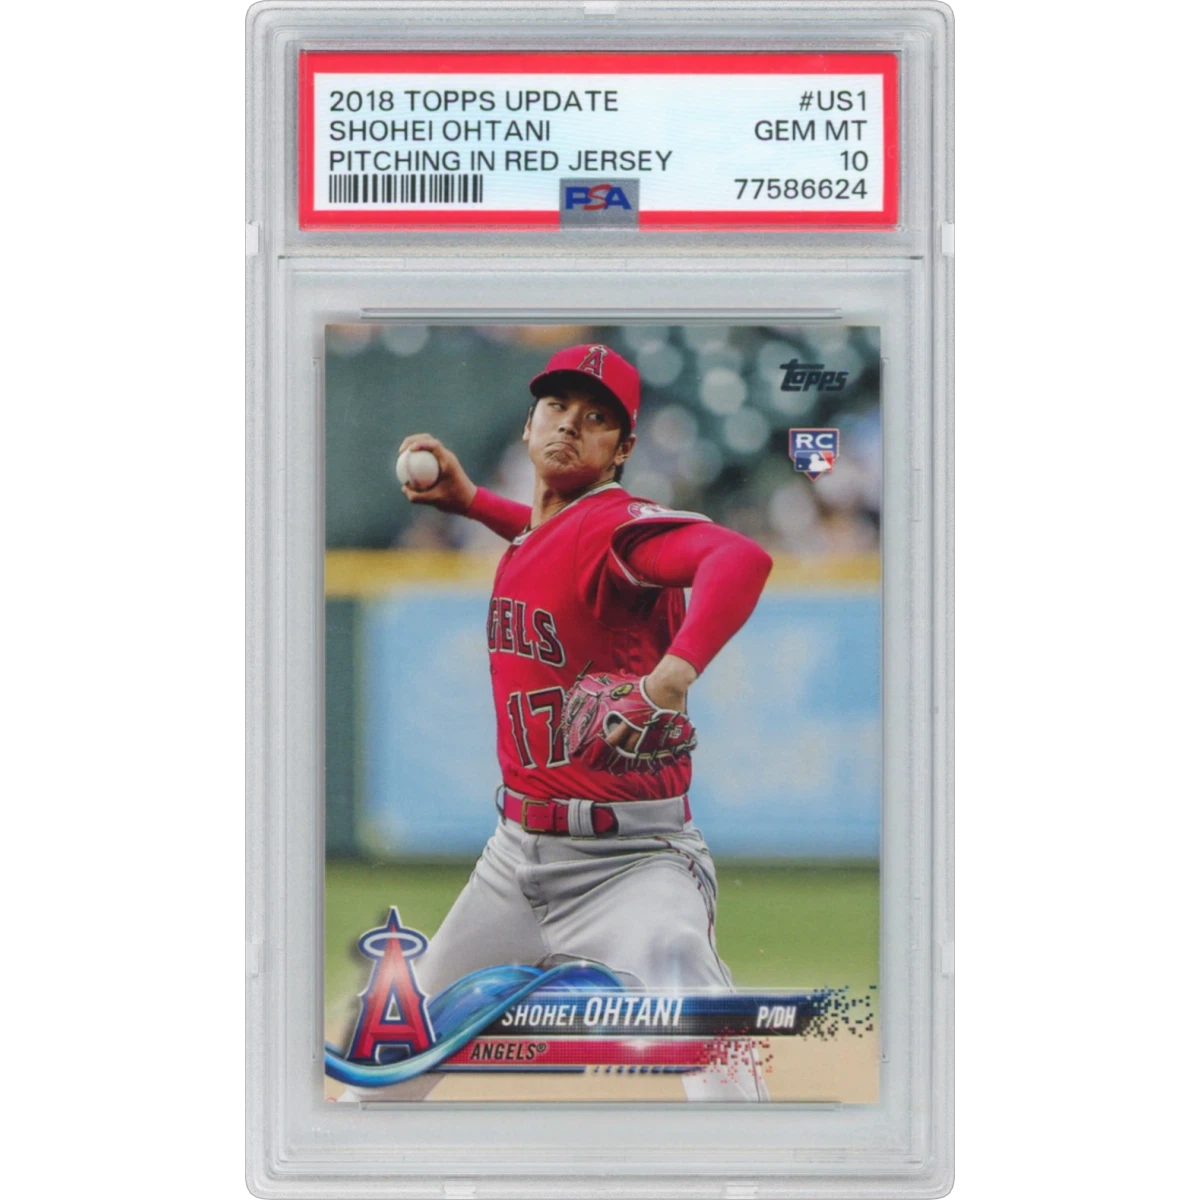 2018 Topps Update #US1 Shohei Ohtani - Pitching in Red Jersey (PSA 10 GEM MINT)$407.509d ago
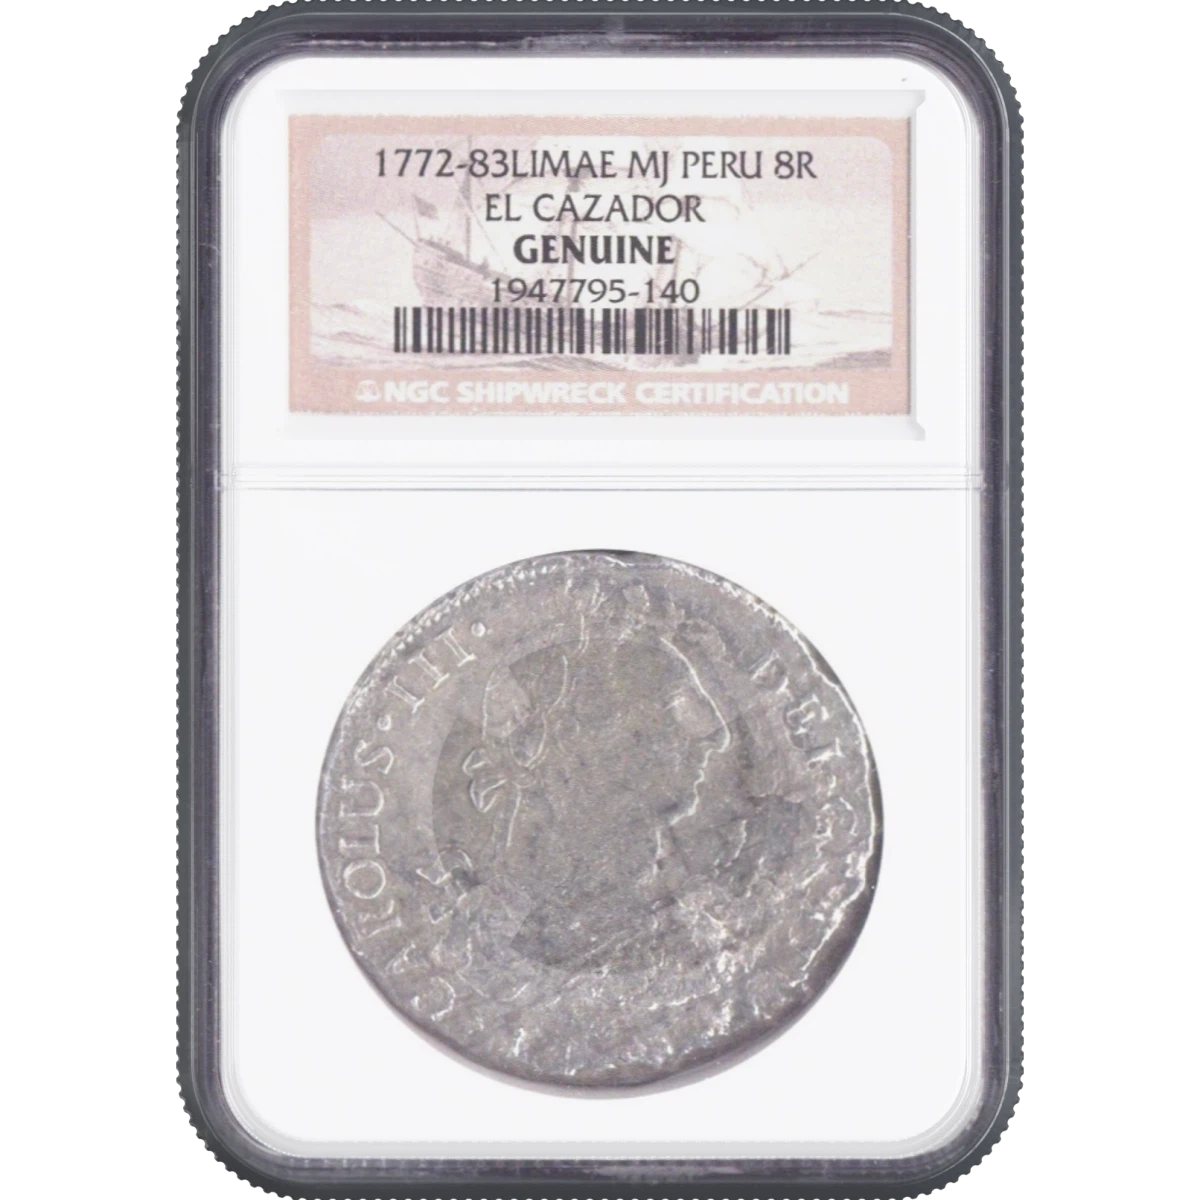 1772-83LIMAE MJ PERU 8R EL CAZADOR NGC GENUINE$385.009d ago
- Doctor Strange #177 CGC 9.4 White Pages (Marvel Comics, 2/69) - Universal$523.5310d ago
- Darth Vader #3 CGC 9.8 White Pages (Marvel Comics, 5/15) - Universal Variant Edition$594.0010d ago
- 2024 One Piece English Version 1st Anniversary Set #006 Tony Tony Chopper (PSA 10 GEM MINT)$629.3012d ago
- 2022 Panini Select Rookie Signatures #RSJWL Jalen Williams - Neon Purple Pulsar Fotl (PSA 10 GEM MINT)$890.7015d ago
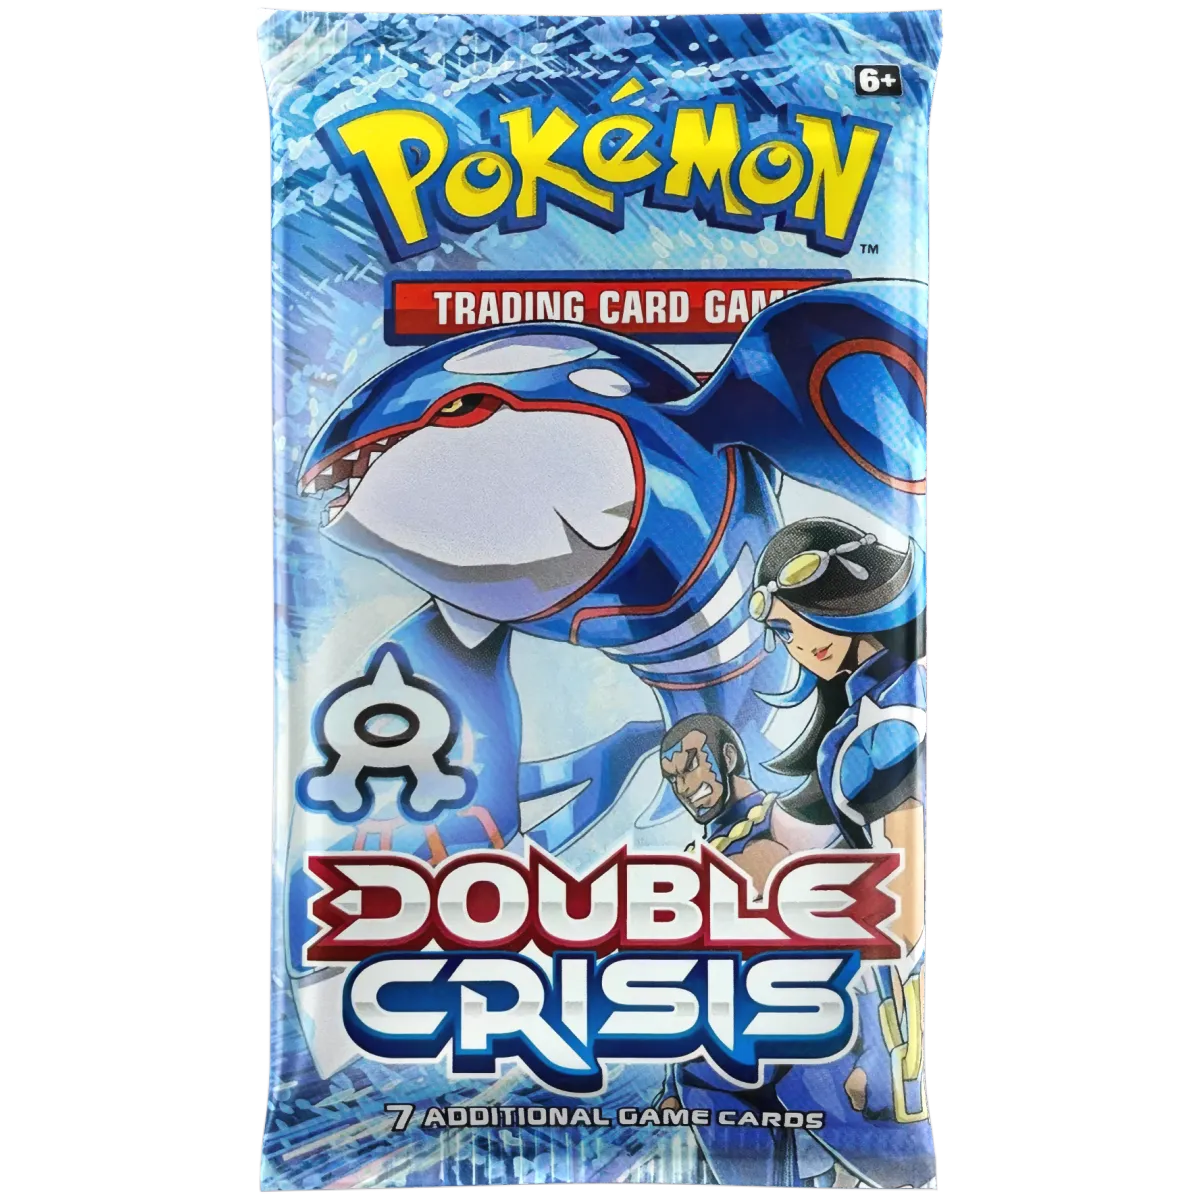 Double Crisis (1 Booster Pack - Art May Vary)$433.9016d ago
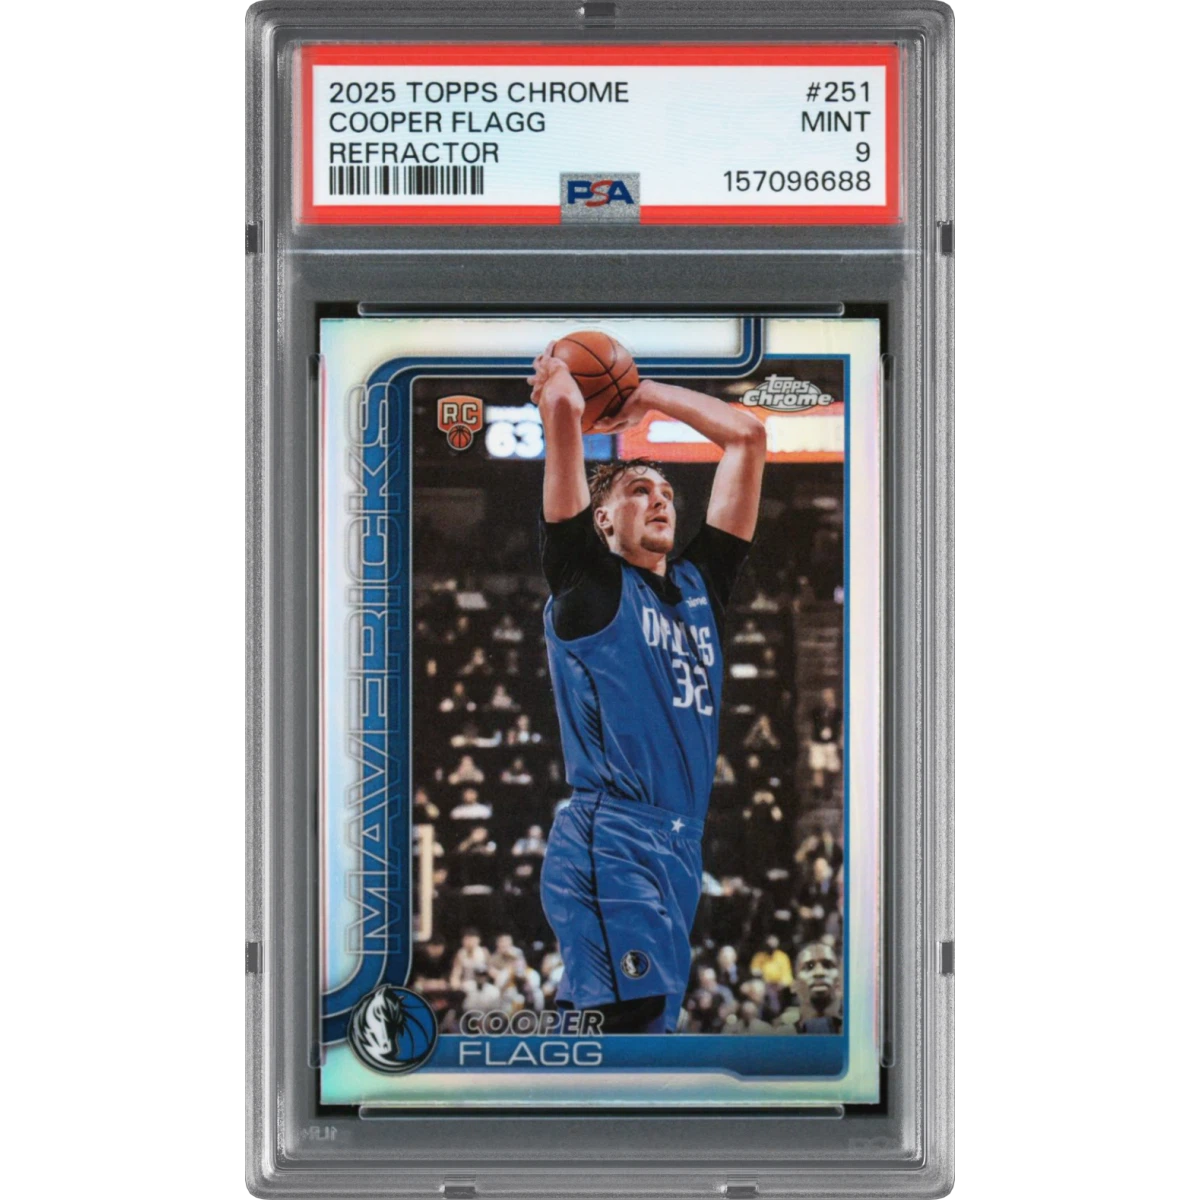 2025 Topps Chrome #251 Cooper Flagg - Refractor (PSA 9 MINT)$367.2016d ago
- 2021 Panini Crown Royale Kaboom! #4 Zion Williamson (PSA 10 GEM MINT)$798.0018d ago
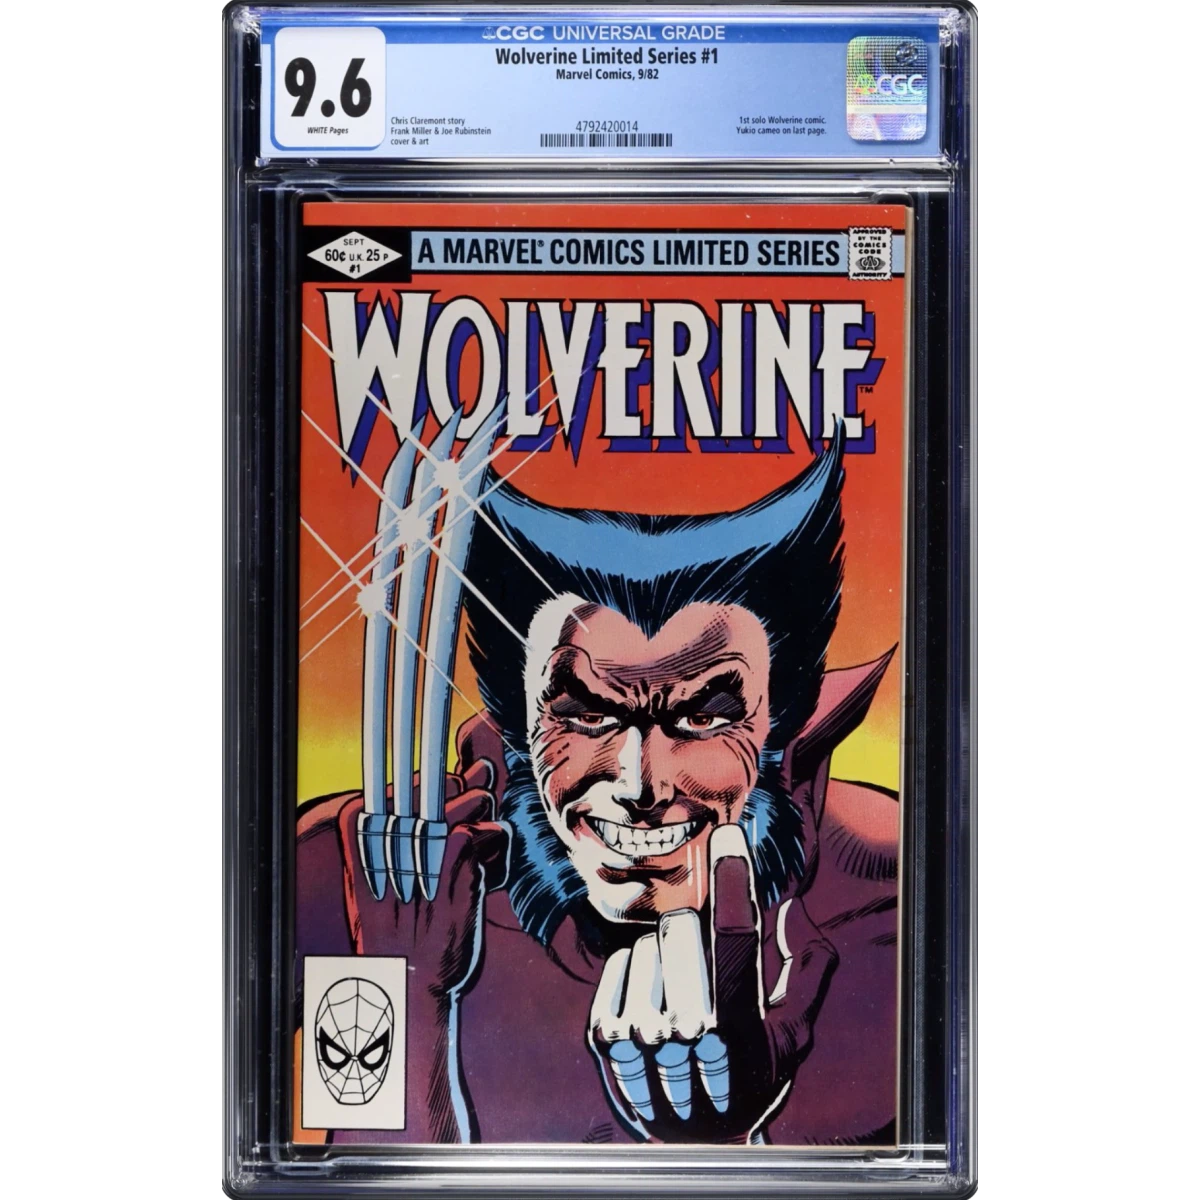 Wolverine Limited Series #1 CGC 9.6 White Pages (Marvel Comics, 9/82) - Universal$370.0018d ago
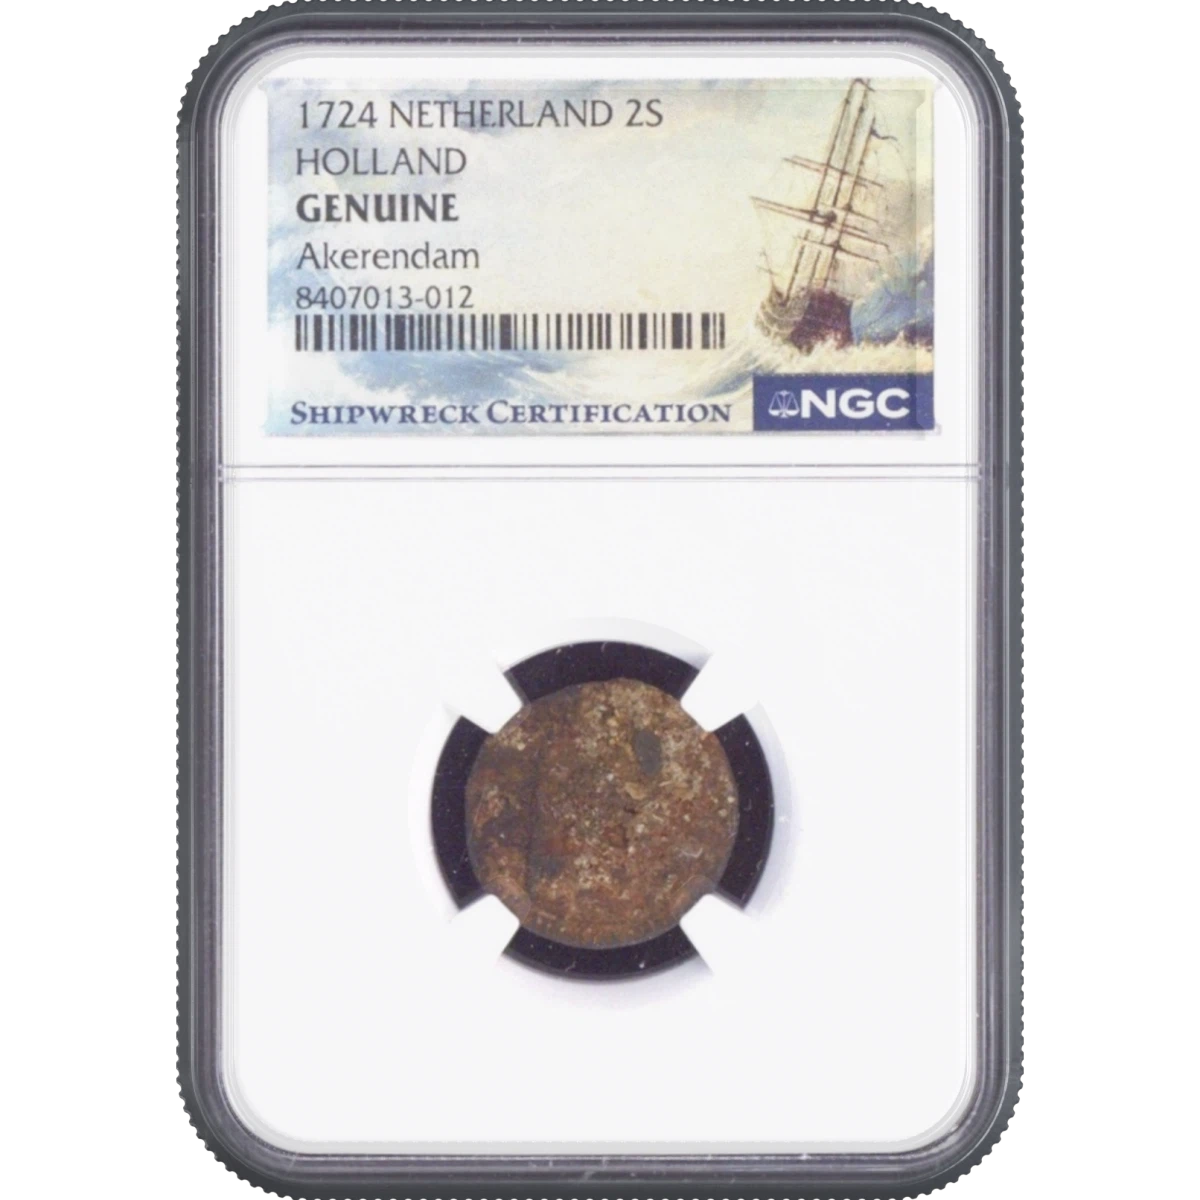 1724 NETHERLAND 2S HOLLAND Akerendam NGC GENUINE$422.0024d ago
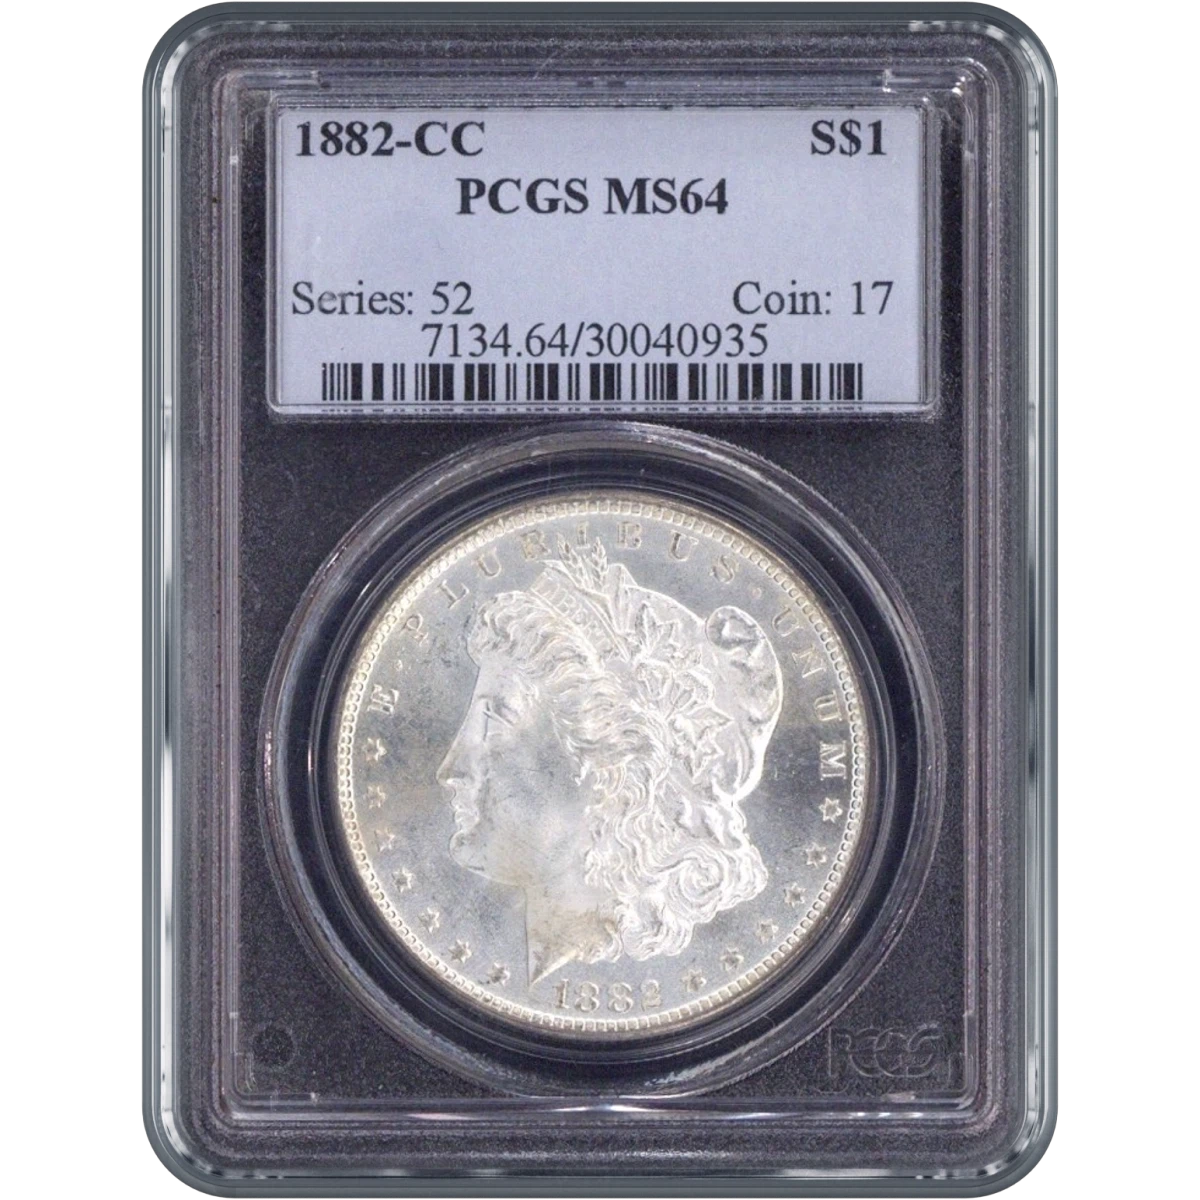 1882-CC One Dollar PCGS MS64$437.5026d ago
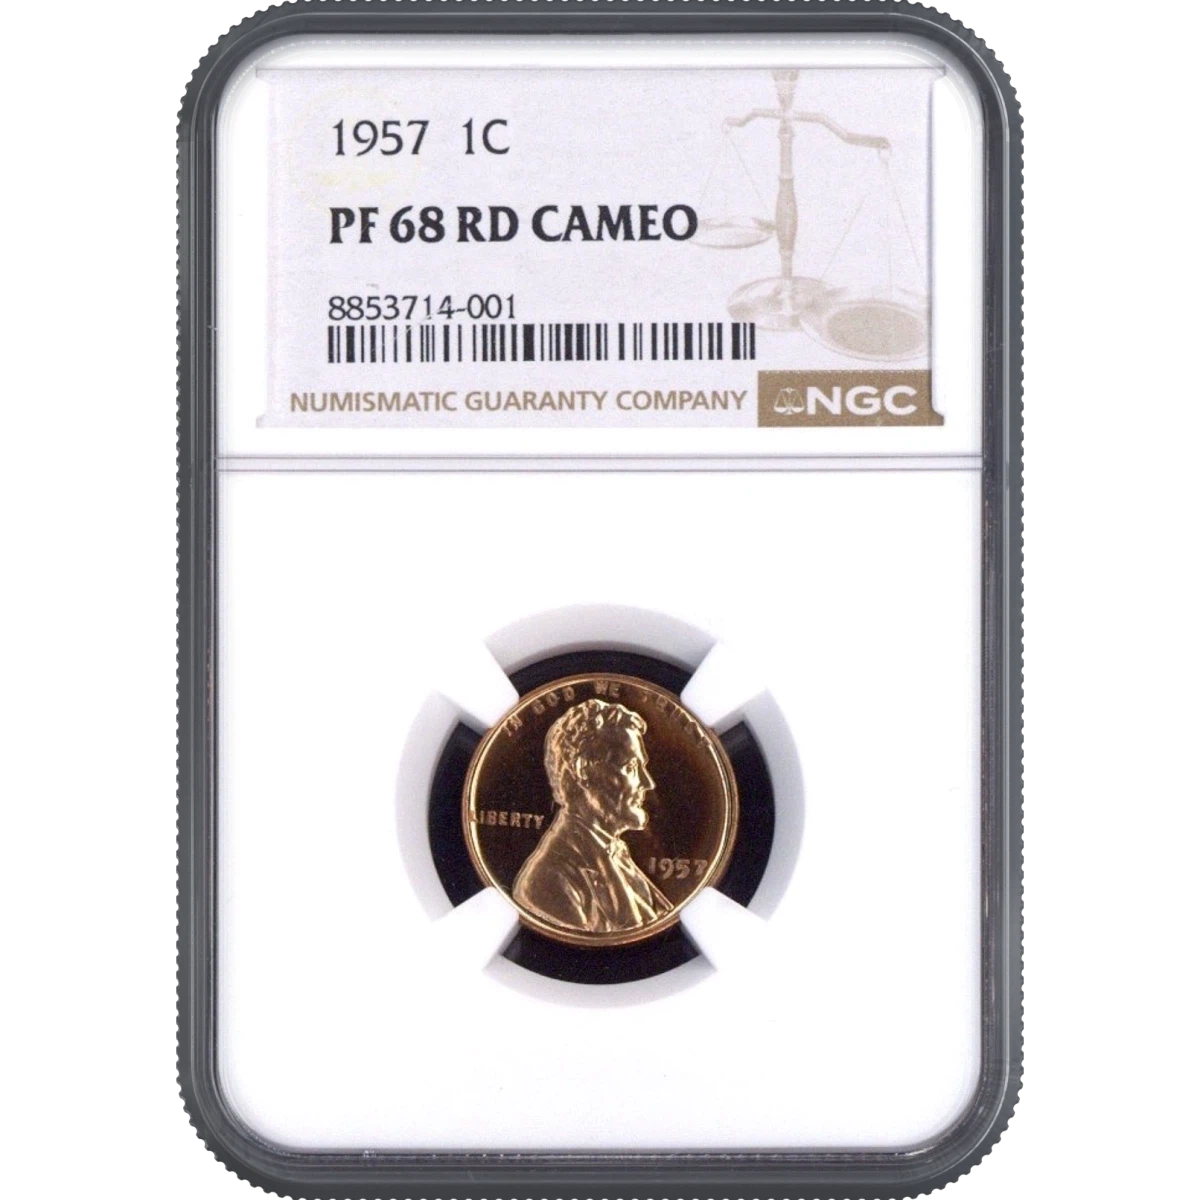 1957 One Cent NGC PF68RDCAMEO$402.5026d ago
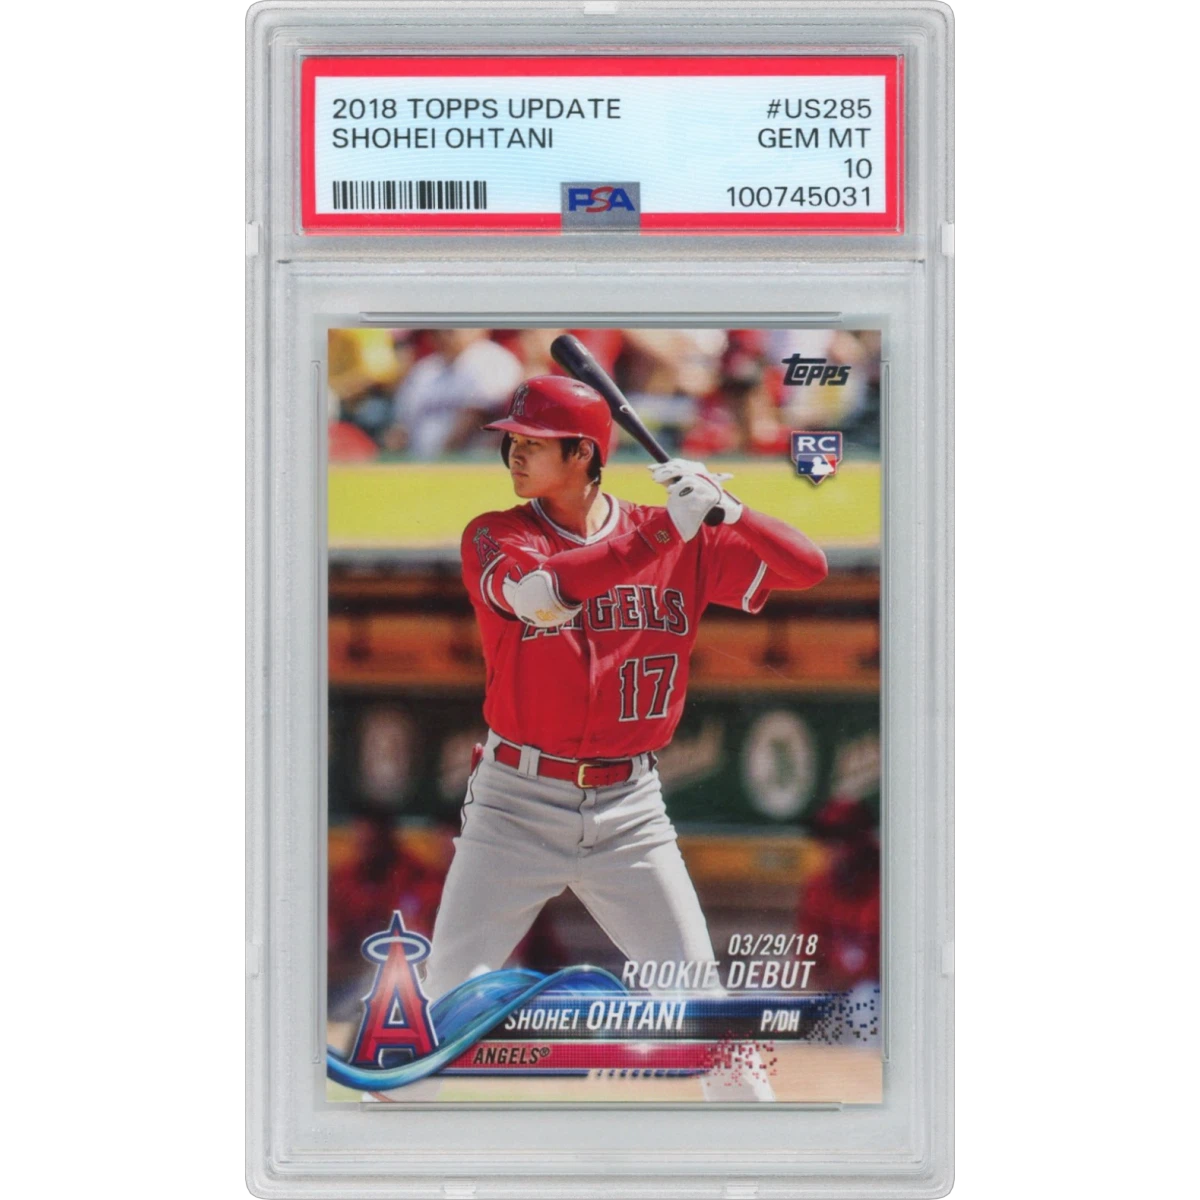 2018 Topps Update #US285 Shohei Ohtani (PSA 10 GEM MINT)$505.3027d ago
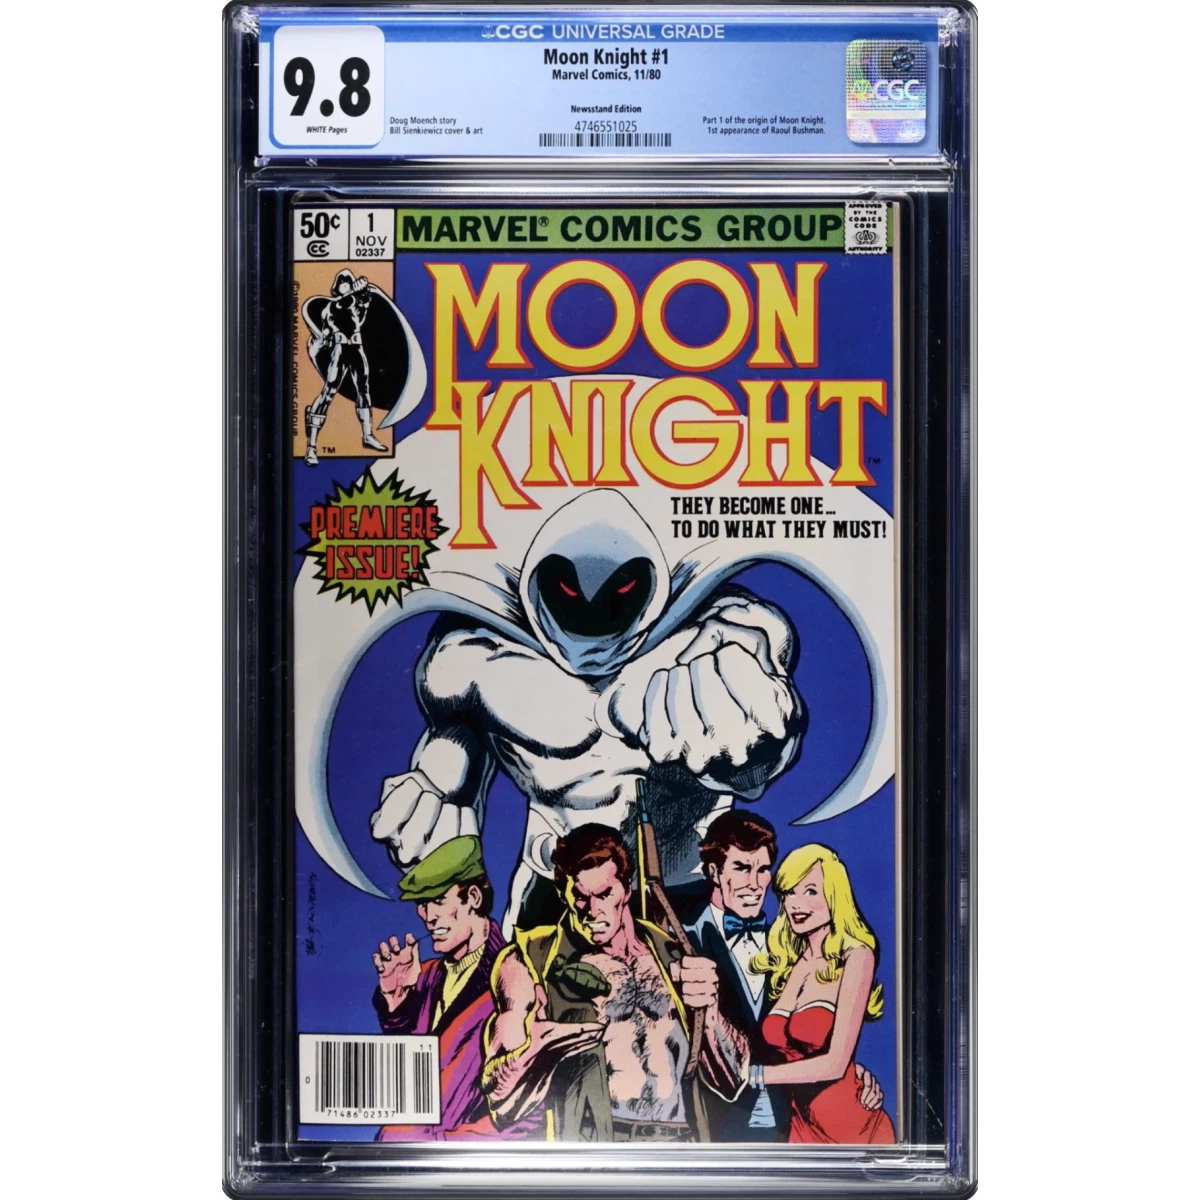 Moon Knight #1 CGC 9.8 White Pages (Marvel Comics, 11/80) - Newsstand Edition Universal$398.0028d ago
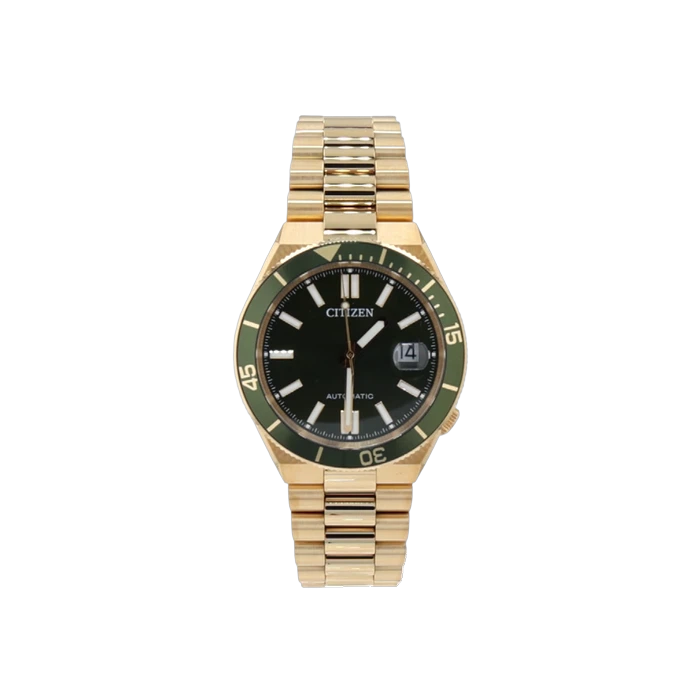 Citizen Tsuyosa Shore Green Dial$476.0028d ago
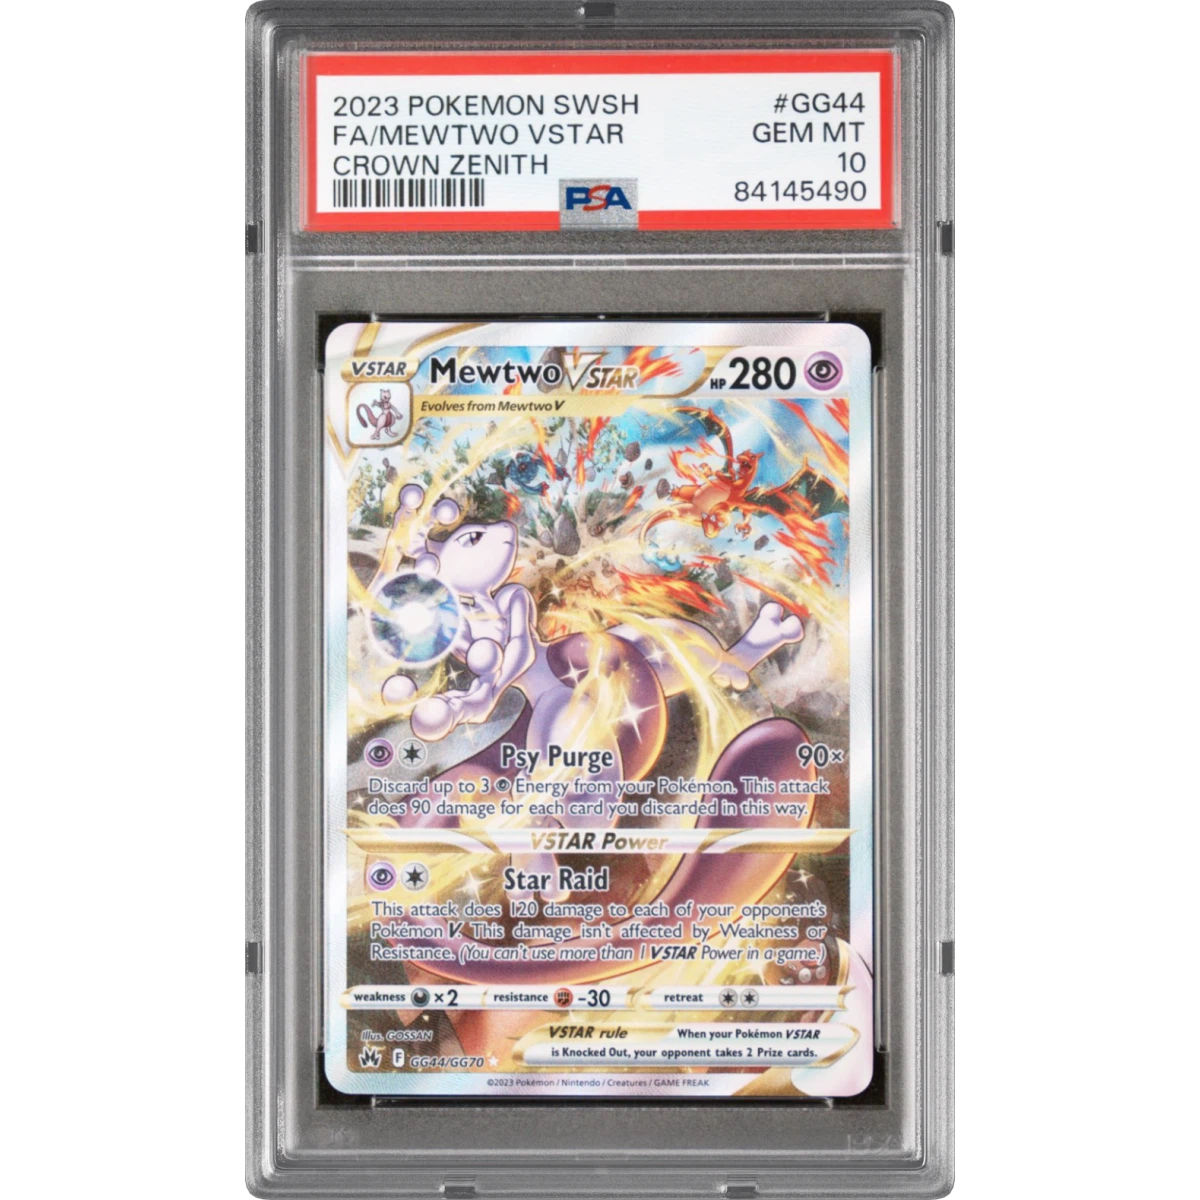 2023 Pokémon Sword and Shield Crown Zenith #GG44 Mewtwo Vstar - Full Art (PSA 10 GEM MINT)$477.8028d ago
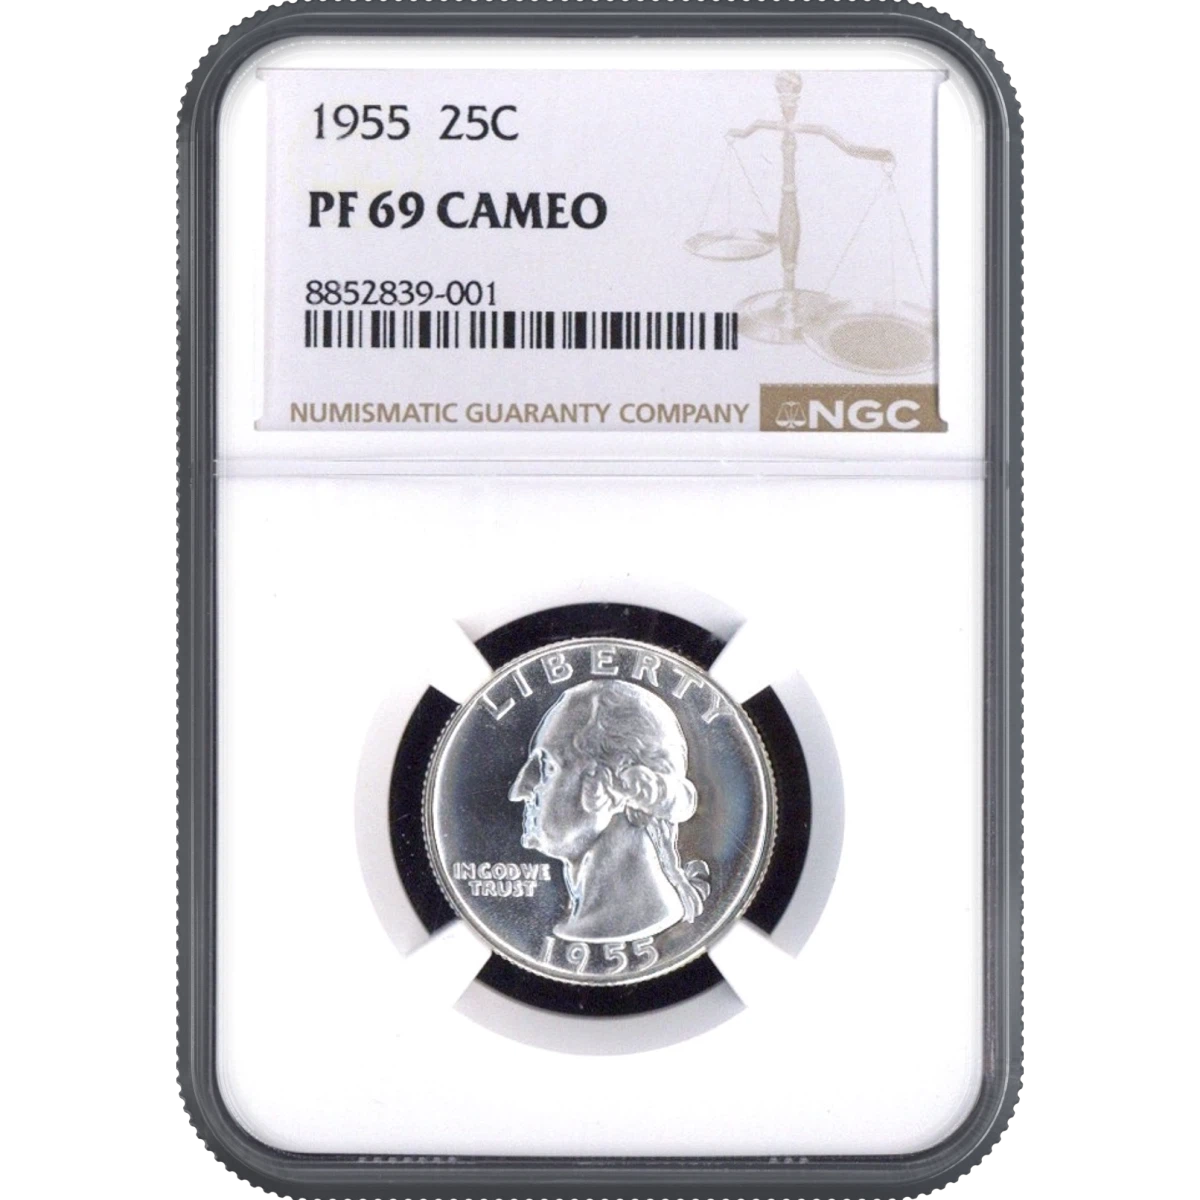 1955 25 Cents NGC PF69CAMEO$415.0028d ago
- Free shows the latest 25 pulls. Pro unlocks the full history + CSV export →
Compare Wildcard Platinum Pack with other Shipwreck packs
Same math, same methodology — cash-out ratios after each pack's own buyback, so the comparison is apples to apples.
- $500 Shipwreck Coins Pack0.960x cash-out · EV $560 · hit rate 35.6%NEAR BREAK-EVEN
- Rolex, AP and Patek Philippe Watch BoxEV $20,742SET PACK PRICE
- Sports Cosmic PackEV $8,164SET PACK PRICE
- Pokémon Cosmic PackEV $9,565SET PACK PRICE
- Premier Watch BoxEV $8,686SET PACK PRICE
- Pokémon VIP CosmicEV $8,551SET PACK PRICE
Understand these numbers
Every figure on this page — EV, EV ratio, hit rate, dilution — is defined once and computed the same way for every pack.