Baseball
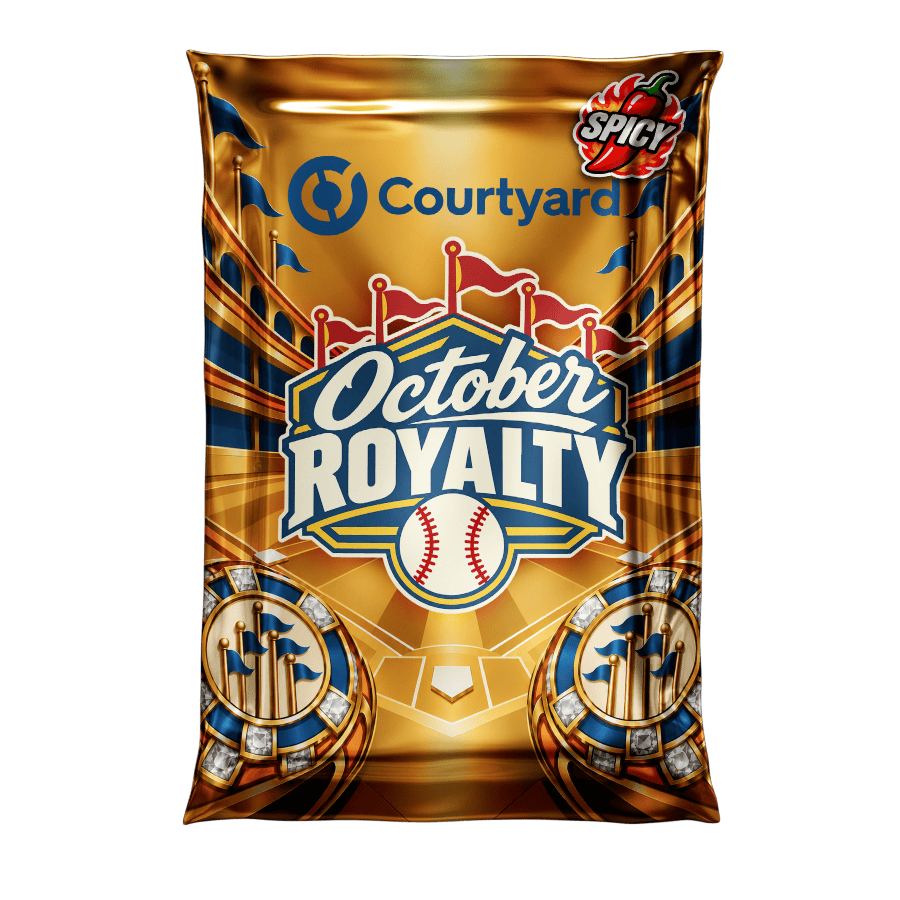
Baseball October Royalty
Baseball October Royalty is a Courtyard Baseball mystery pack with a calibrated expected value of $89.48 and a typical (median) pull of $54.20 across 41 indexed pulls. Its pack price is not yet confirmed, so the EV ratio, hit rate, and Rip Advisor verdict are pending.
Calibrated EV
$89
- Calibrated EV
- $89
- Cash-out EV
- $76
- Pack price
- Unknown
- Typical pull
- $54
- Hit rate
- —
- Lifetime EV
- $90
- Pulls indexed
- 41
- Last pull
- 1h ago
01 / Rip Advisor
Is Baseball October Royalty worth it right now?
- No pack price on record, so no net or ROI figure can be computed.
Verdict is computed transparently from indexed pulls: cash-out ROI, median pull, 7-day trend, hit rate, and sample size. Redemption shipping (typically $16+) is not included — cards worth less than a few times the shipping cost are usually better instant-sold than shipped. Not financial advice.
02 / Pool signals
What's happening in the Baseball October Royalty pool
No price set — pool economics can’t be computed.
No price set — pool economics can’t be computed.
Pro adds the Pool Health score and chase-removal impact.
Not observable: packs remaining, value remaining, and which chases are still in the pool — Courtyard publishes a pull feed, not inventory. We label those unavailable rather than estimate them. Everything above is computed from indexed pulls and EV snapshots; thin or stale data pulls the score toward neutral. Formula
Chase tracker
No pack price set, so a chase tier cannot be anchored.
Signal lifetime
SIGNAL Fresh · 1.9 h agoRecomputed against pulls indexed in the last few hours.
- Newest pull
- 1.9 h
- observed
- Pull rate
- too soon
- observed
- Pulls, 7d
- 41
- observed
- Half-life
- Pro
Aged, not predicted. Half-life counts how fast new evidence arrives, measured from real pull timestamps — it is not a forecast of where EV is heading. We publish no EV-drift half-life because our snapshot history is still too short for a regression to mean anything. The seeded placeholder points this note used to warn about have been flagged in the database and excluded from every chart, trend and score, so what you see plotted is observed data. Note the headline EV is decay-weighted, so it reacts to new pulls sooner than this whole-sample horizon implies. Methodology
03 / Contents
What has come out of Baseball October Royalty
By era
Cards seen range from 1952 to 2025.
- Vintage (pre-2000)54%$110 avg
- Current (2020+)34%$57 avg
- Modern (2010-2019)7%$98 avg
- Retro (2000-2009)5%$88 avg
Most common sets
Sets these pulls came from.
- Topps41%$122 avg
- Bowman Chrome Prospect Autographs5%$59 avg
- Pinnacle5%$45 avg
- Bowman2%$92 avg
- Bowman Chrome2%$47 avg
- Bowman Draft Bowman Draft Night2%$66 avg
- Bowman Draft Chrome Prospect Autographs2%$48 avg
- Bowman Mega Box Chrome2%$48 avg
Cards seen most often
Named on every readable pull.
- Paul Skenes7%$52 avg
- Aaron Judge5%$124 avg
- Alex Rodriguez5%$45 avg
- Adley Rutschman2%$50 avg
- Bo Jackson2%$51 avg
- Bobby Witt Jr.2%$48 avg
- Brendan Donovan2%$51 avg
- Brooks Lee2%$50 avg
Built from the 41 indexed pulls of this pack so far — a record of what has come out, not a promise about what is left.
04 / Floor safety
Baseball October Royalty floor safety & buyback reality
In Baseball October Royalty, the top 2% of pulls account for 12% of all pulled value — low dilution. Value is spread fairly evenly across the pool, so the average is close to what a typical rip returns. The observed instant-offer ratio is 85% of FMV, which is the cash number every verdict on this page already uses.
Floor safety
low dilution12% of everything this pack has paid out came from just the top 2% of pulls. Value is spread broadly across pulls, so the average sits closer to the typical rip here than it does on a top-heavy pack. It still sits above the median — check both.
Buyback reality
84.6% of FMV observedAcross 41 indexed pulls that carry a recorded bid, a $100 FMV pull cashes out around $85 if you instant-sell — in line with the platform's 84.6%. This is the figure every verdict on the site multiplies by.
Holding, listing, or physically redeeming can beat the instant offer — but redemption shipping (typically $16+) eats small wins.
Net exit value
41 paired pulls · 100% bid coverage · confidence 81%Instant-selling the average (mean) pull here returns $75.84 — $13.81 below sticker FMV (15.4% haircut). That figure is the average of bids we actually recorded, not the platform rate applied blind.
Pro compares all three exits side by side, with the redemption breakeven and the value-by-value haircut curve for this pack.
Bids are recorded, resale is not. Instant-buyback figures are real offers captured at index time and can move. Redemption shipping starts near $16 in the US, is higher internationally, and is charged per shipment — batching pulls lowers it. We publish no resale estimate, liquidity score, or time-to-sell, because no such data is available to us. How buyback works
05 / Observed odds
Baseball October Royalty odds — observed, not posted
- Under $27
- $27 – $54
- $54 – $108 · beats the pack
- $108 – $271 · big hit
- $271+ · chase
Observed across 41 indexed pulls — what actually came out of this pack, independent of the posted odds. The 48h column shows tier drift: a falling green tier means fewer of the good cards have come out lately — which may mean they are running out, or may just be a quiet 48 hours.
07 / Big hits
Biggest Baseball October Royalty pulls
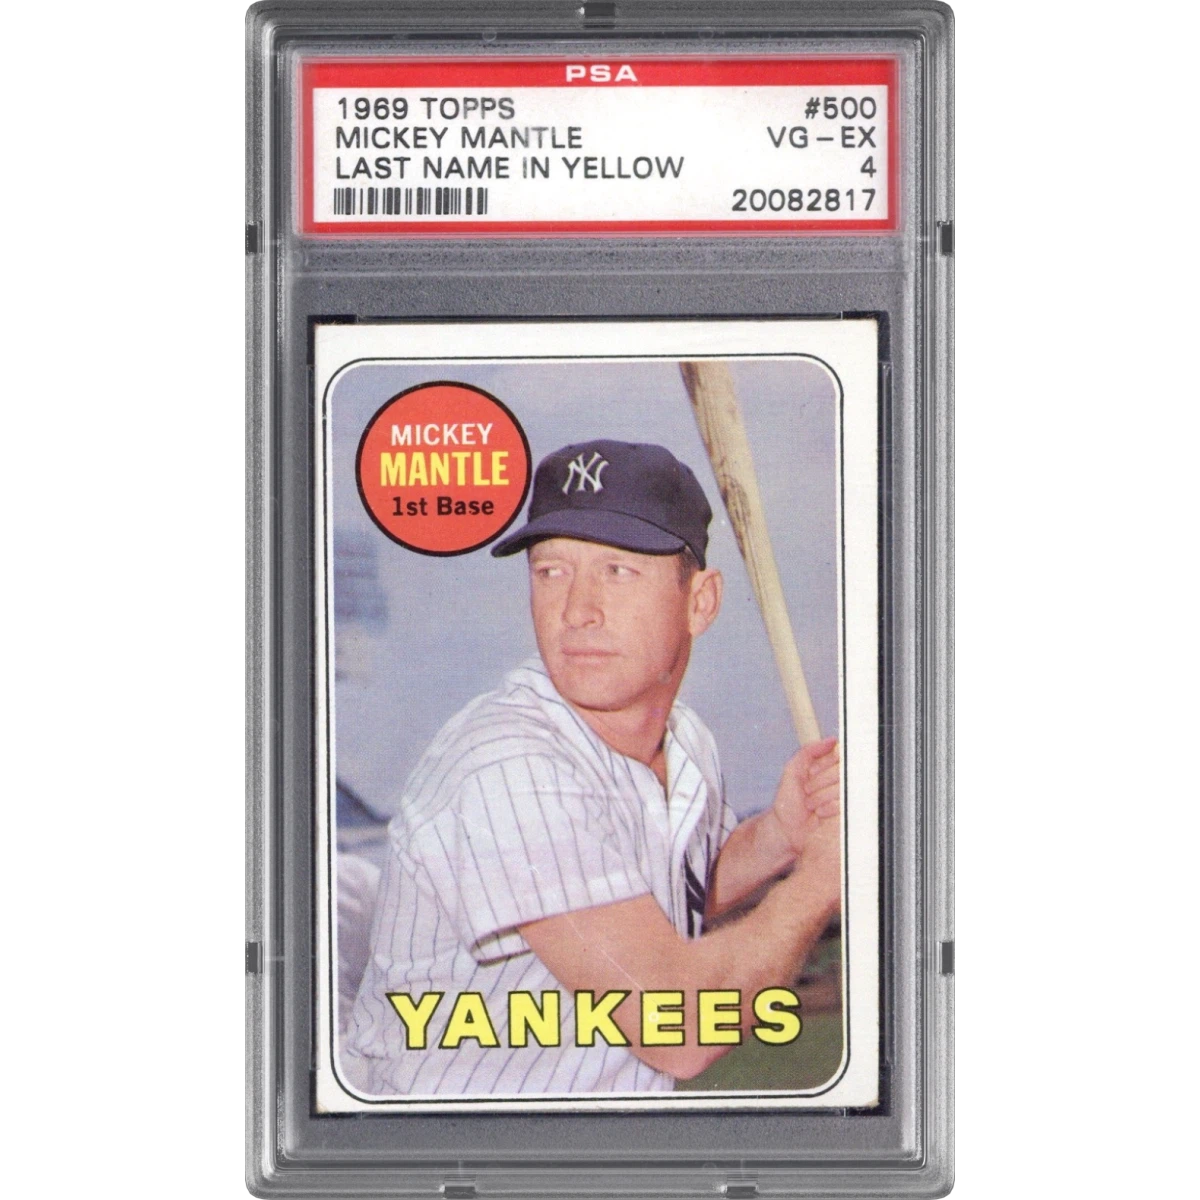
1969 Topps #500 Mickey Mantle - Last Name in Yellow (PSA 4 VG-EX)
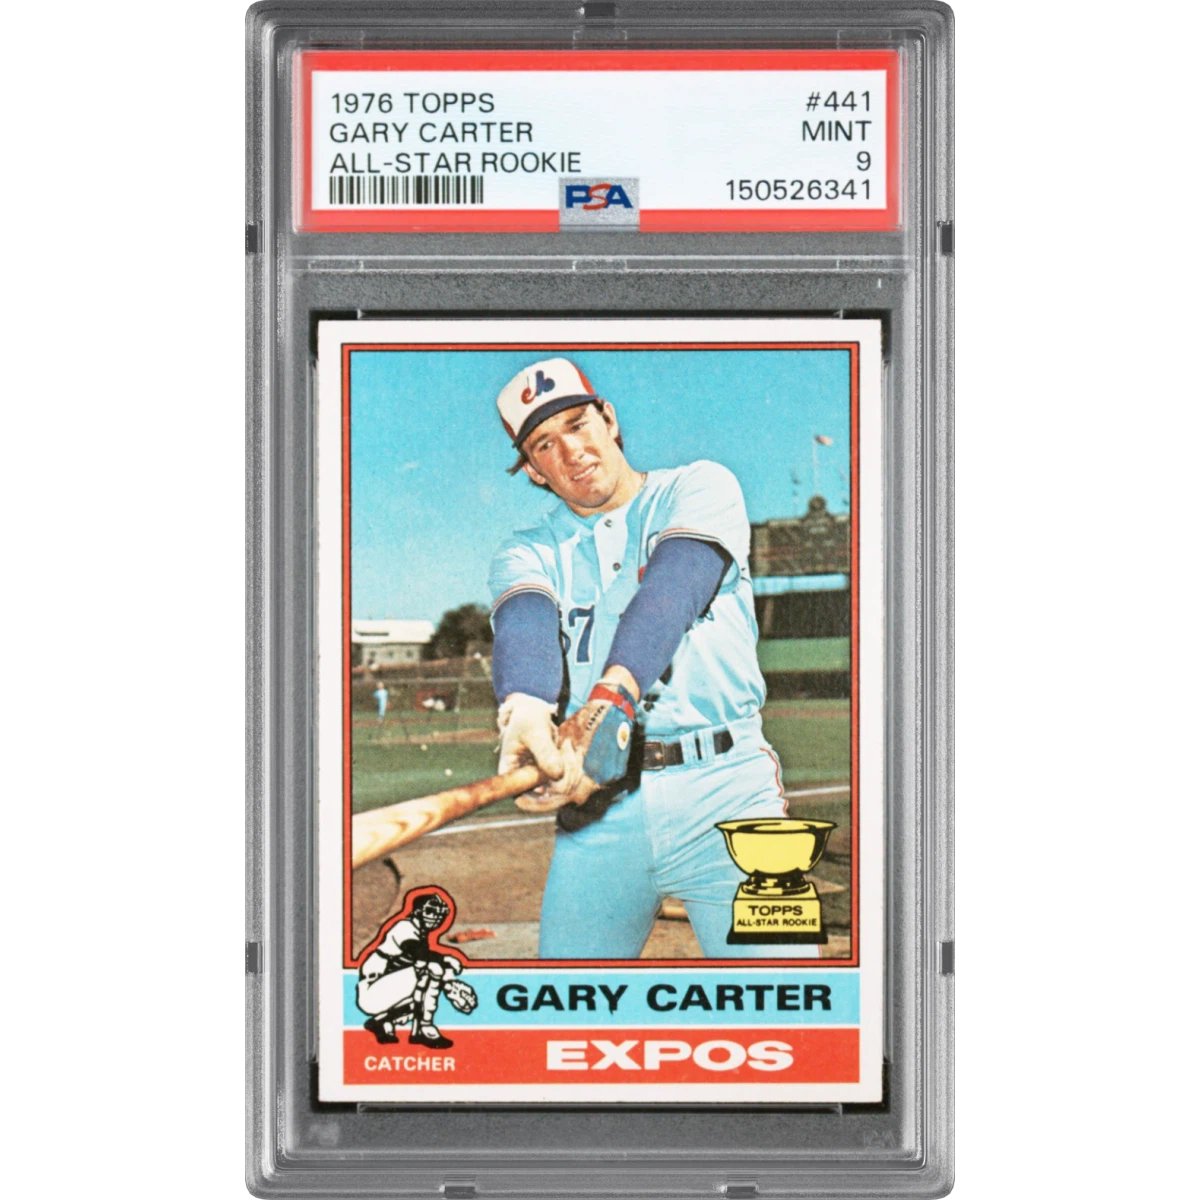
1976 Topps #441 Gary Carter - All-Star Rookie (PSA 9 MINT)
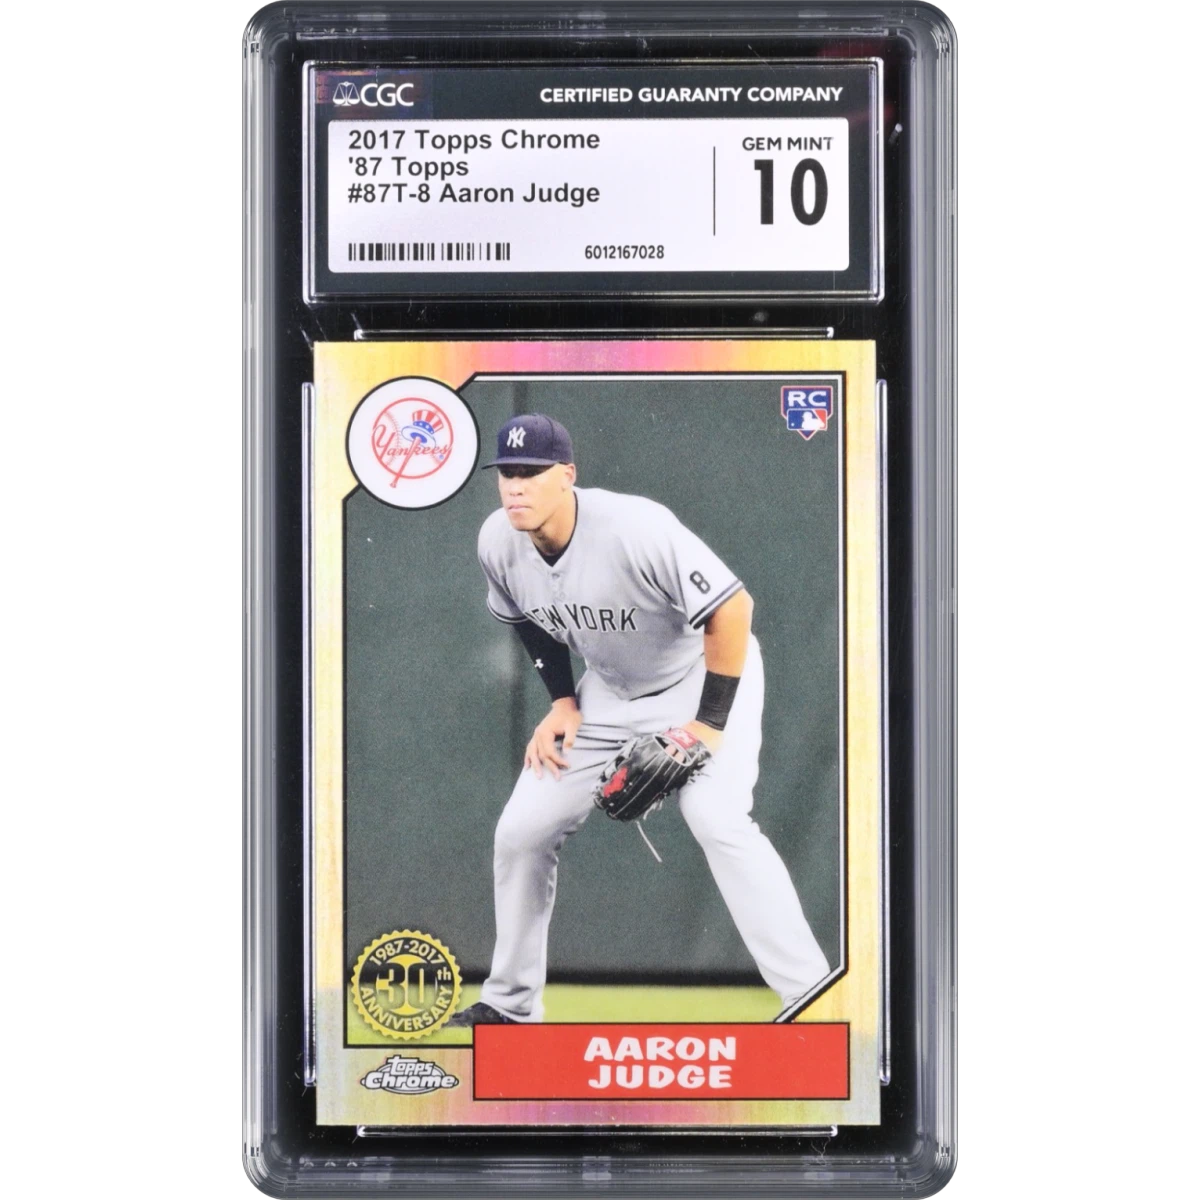
2017 Topps Chrome 1987 Topps #87T8 Aaron Judge (CGC 10 GEM MINT)
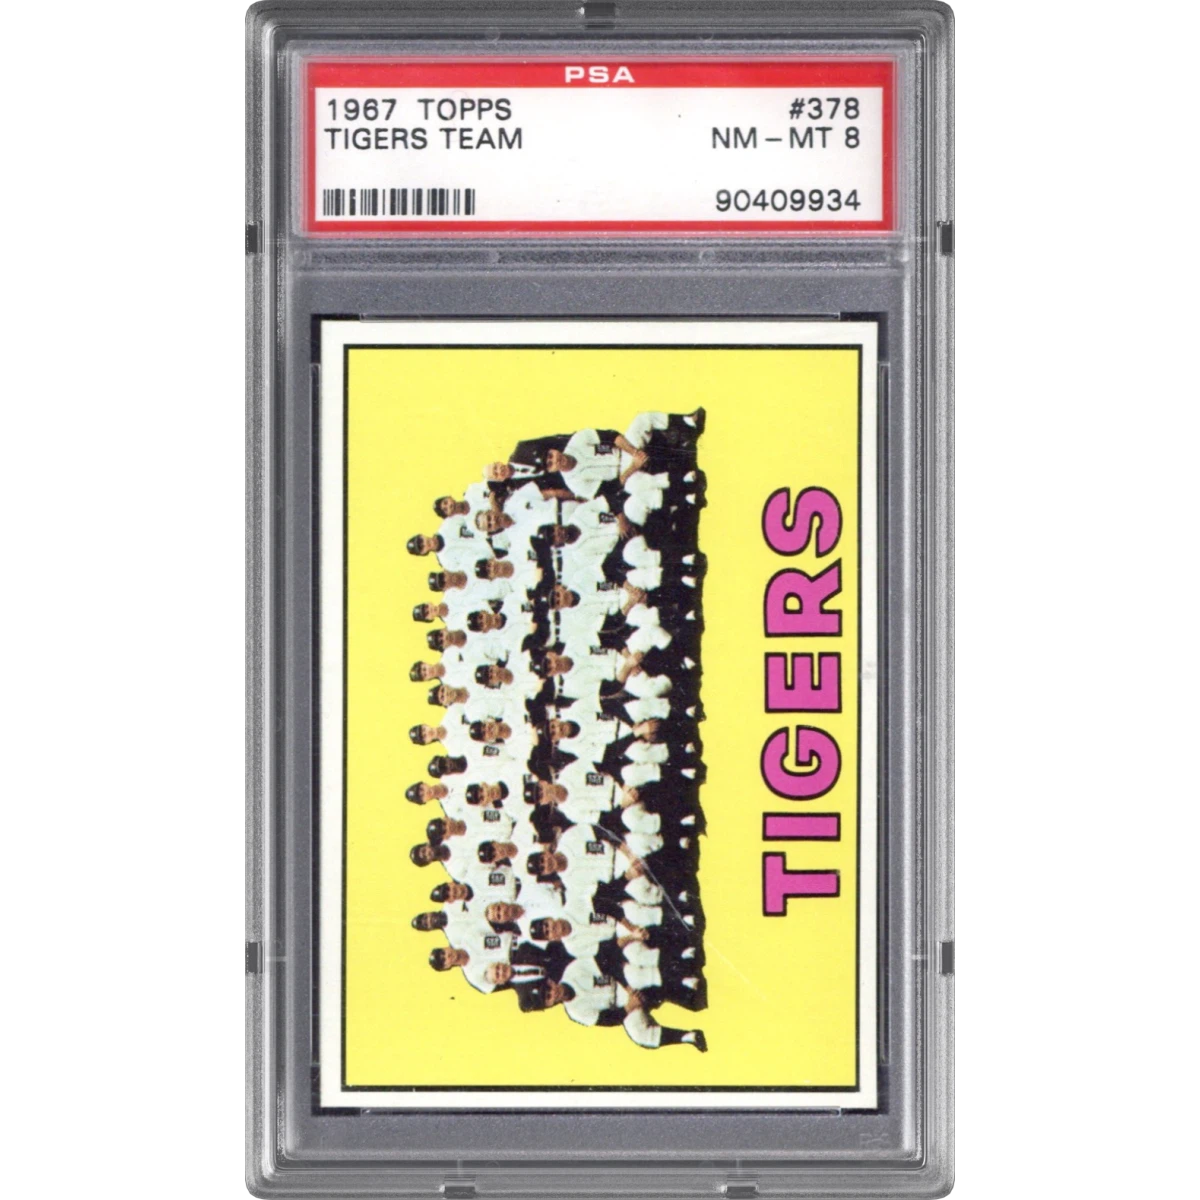
1967 Topps #378 Tigers Team (PSA 8 NM-MT)
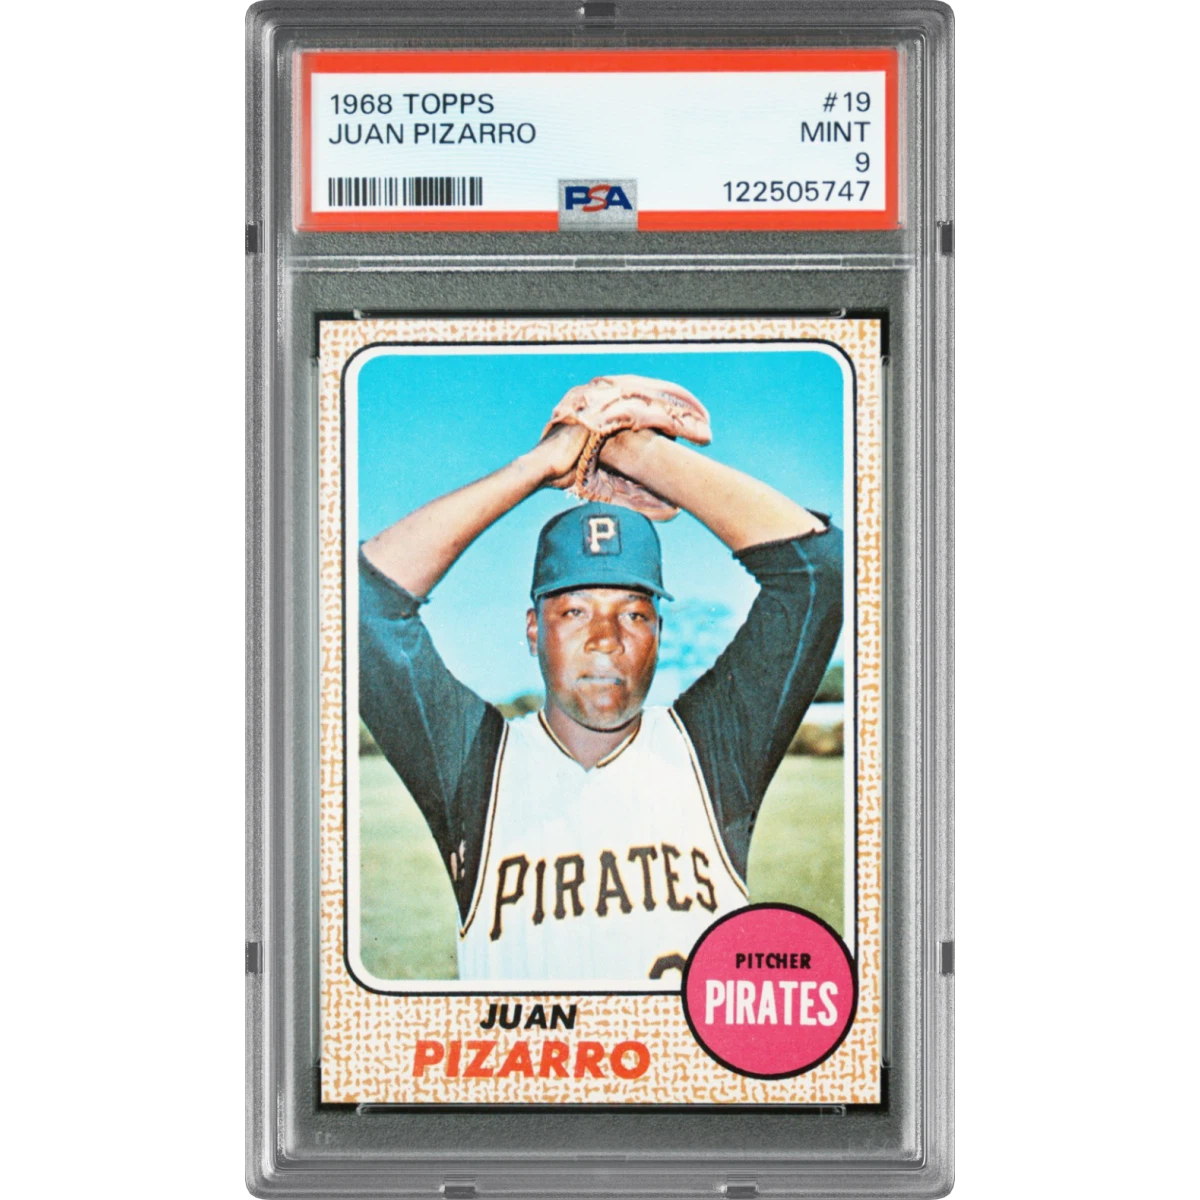
1968 Topps #19 Juan Pizarro (PSA 9 MINT)
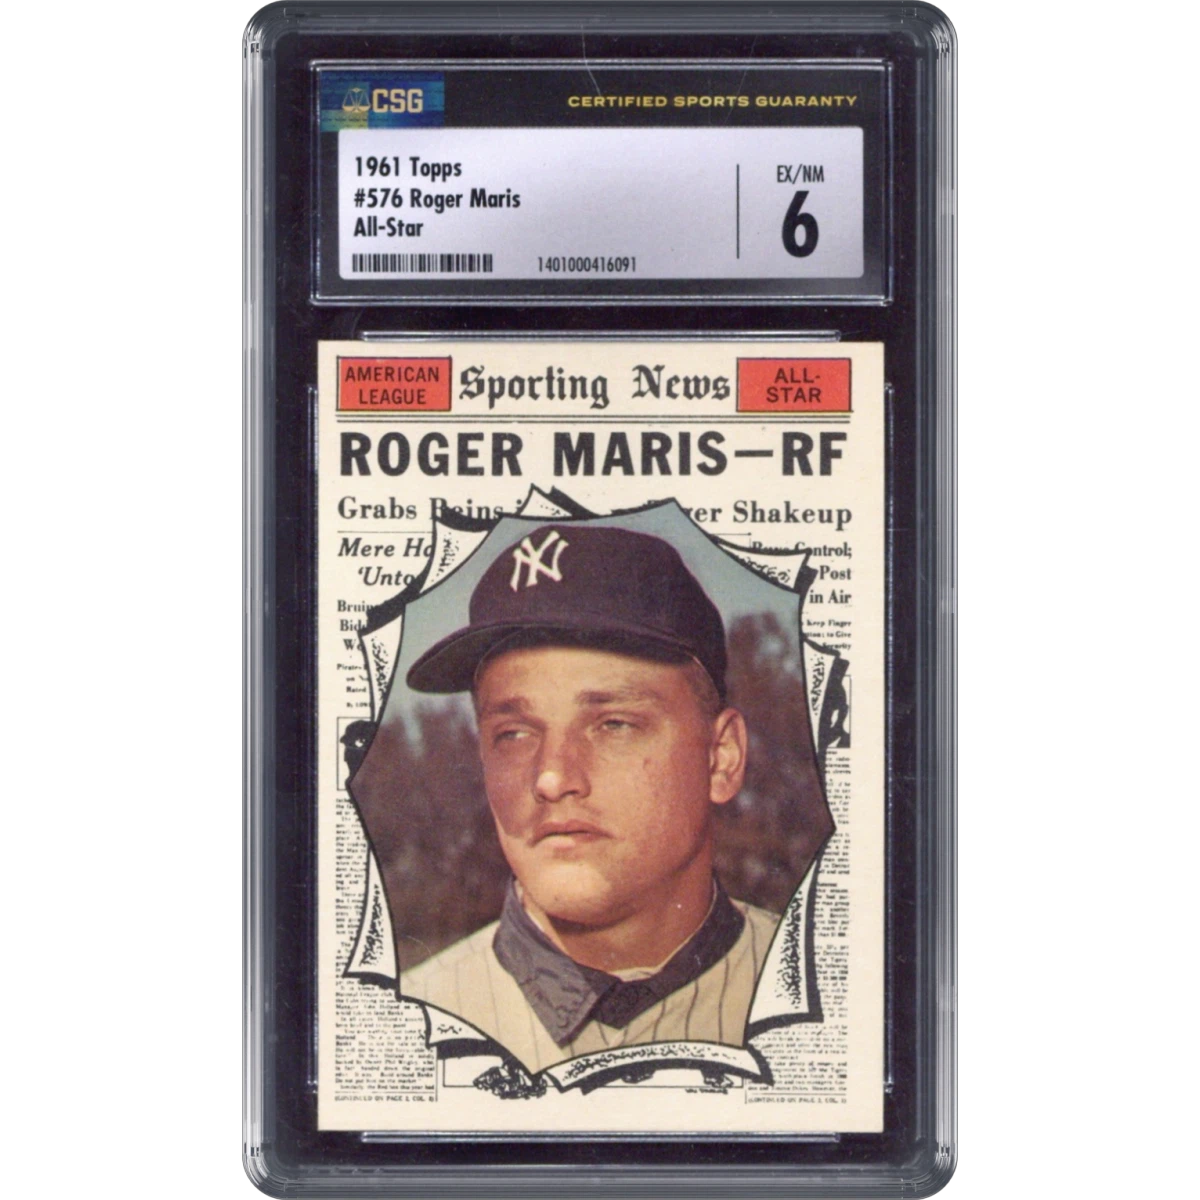
1961 Topps #576 Roger Maris - All-Star (CSG 6 EX-NM)
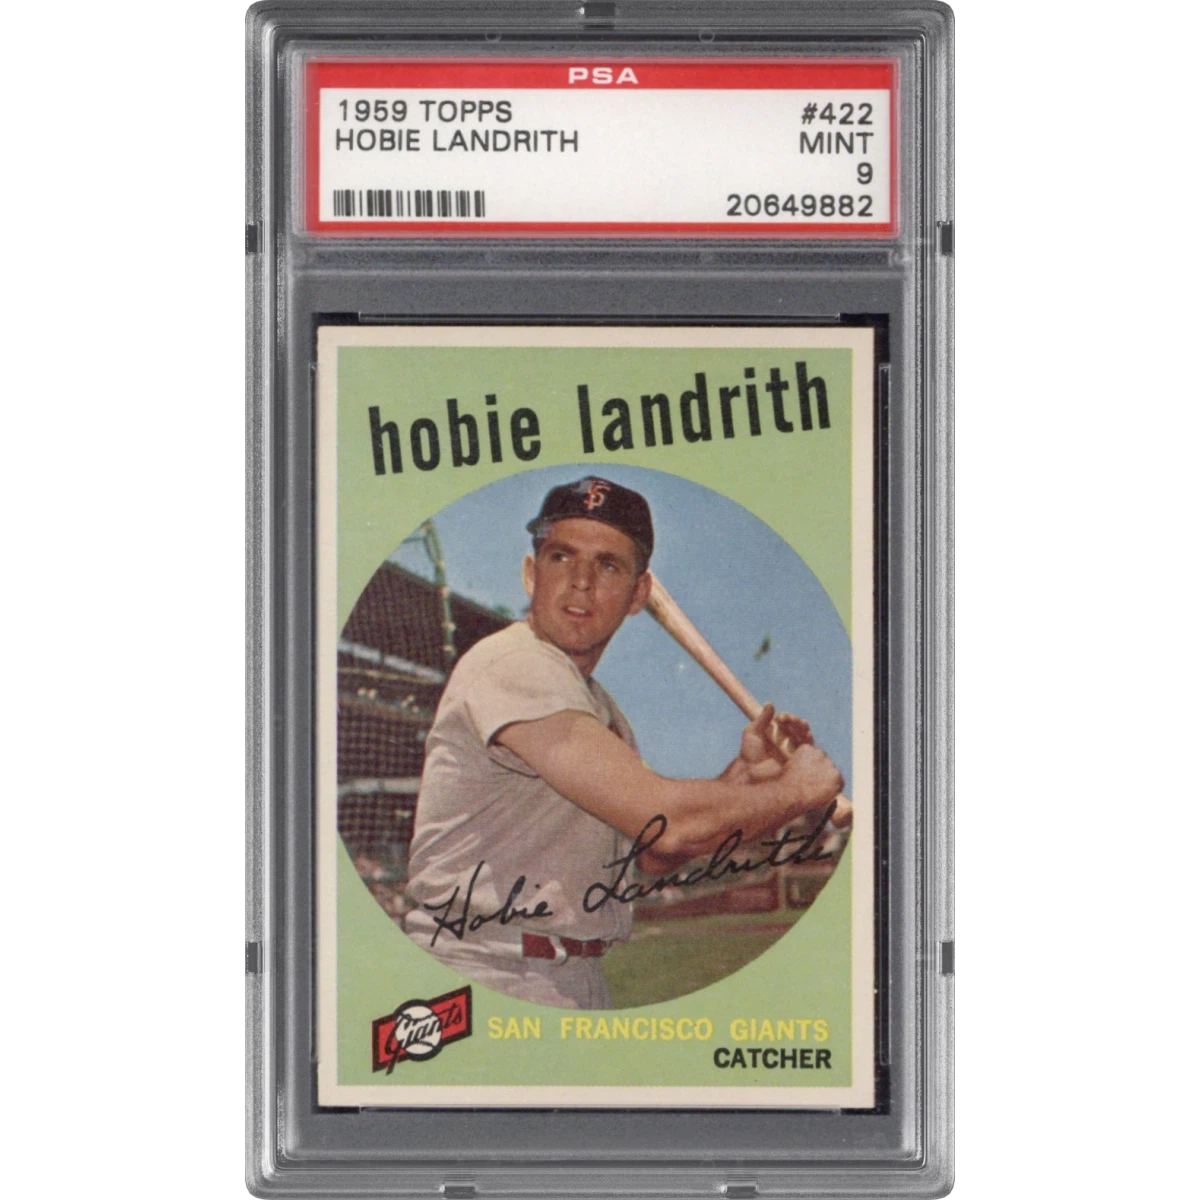
1959 Topps #422 Hobie Landrith (PSA 9 MINT)
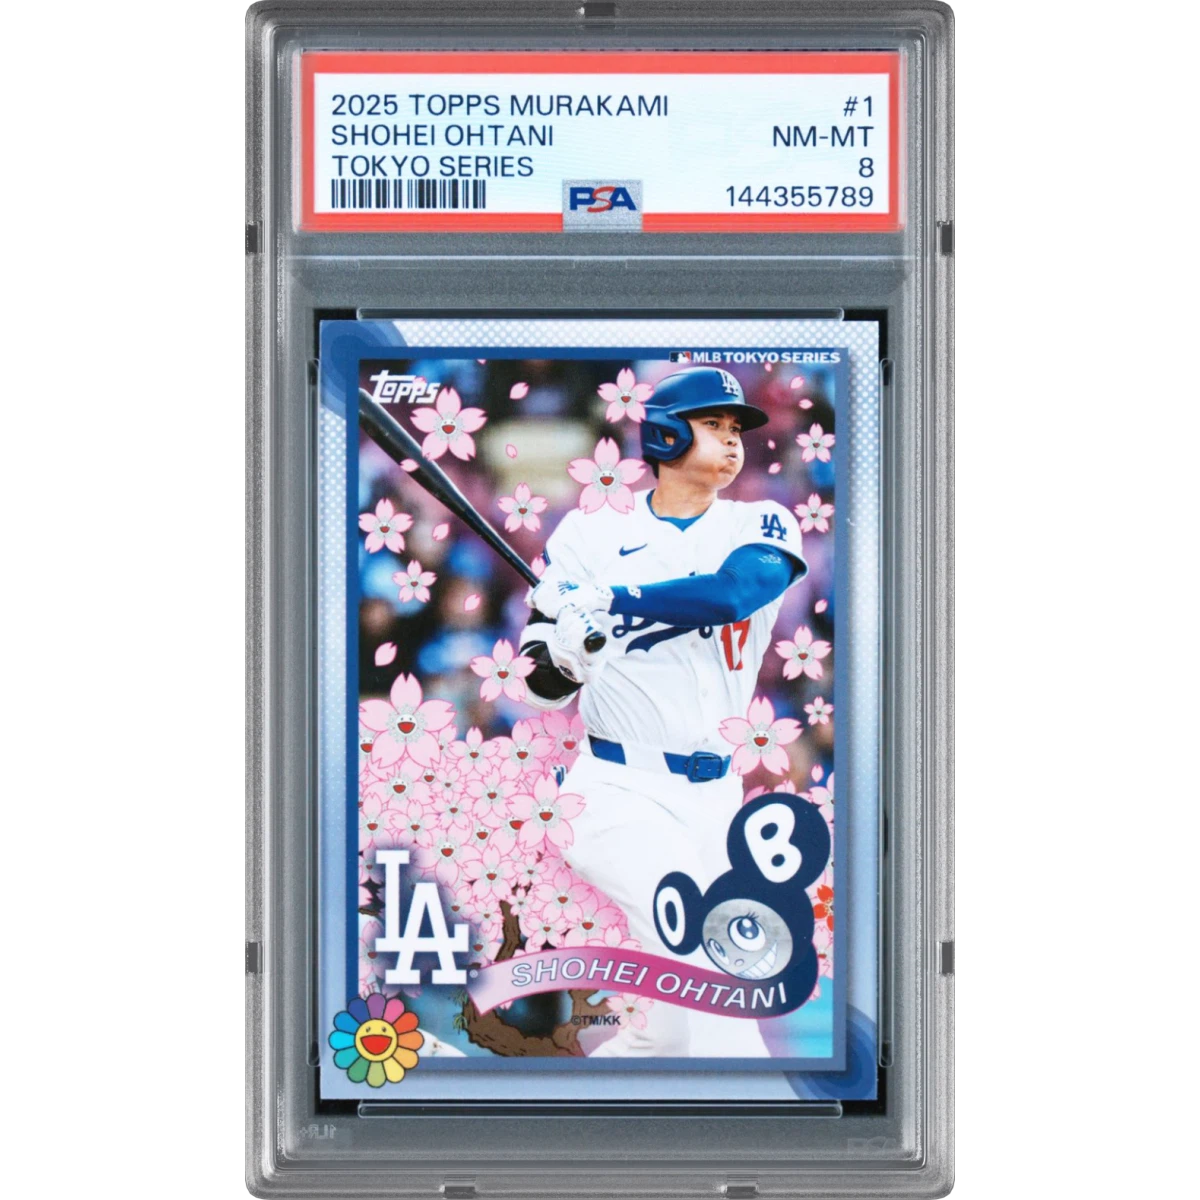
2025 Topps Takashi Murakami + MLB World Tour Tokyo Series #1 Shohei Ohtani (PSA 8 NM-MT)
08 / EV history
Baseball October Royalty EV over time
Calibrated EV currently sits at $89.48, and has moved down 13.9% over the last 7 days.
EV over time: 71 points from Oct 23 to Oct 23, starting at $106 and ending at $89, down overall (-15.3%), ranging between $89 and $136.
09 / Quick answers
Baseball October Royalty — quick answers
- Is Baseball October Royalty worth buying right now?
- Our current verdict is NO DATA (score 0/100). No pack price on record, so no net or ROI figure can be computed.
- What is the EV of Baseball October Royalty?
- The calibrated EV is $89.48 against a pack price of not yet set, with a typical (median) pull of $54.20 across 41 indexed pulls.
- What are the real odds of beating the pack price on Baseball October Royalty?
- We cannot say yet. Baseball October Royalty has no pack price on record, and the odds of beating a price are undefined until there is one to beat. The 41 indexed pulls are still shown below as a record of what has come out.
- What is the typical pull from Baseball October Royalty?
- The median pull is $54.20 — half of all indexed rips returned less than that. The single best recorded pull is $457.90.
10 / Pull log
Latest Baseball October Royalty pulls
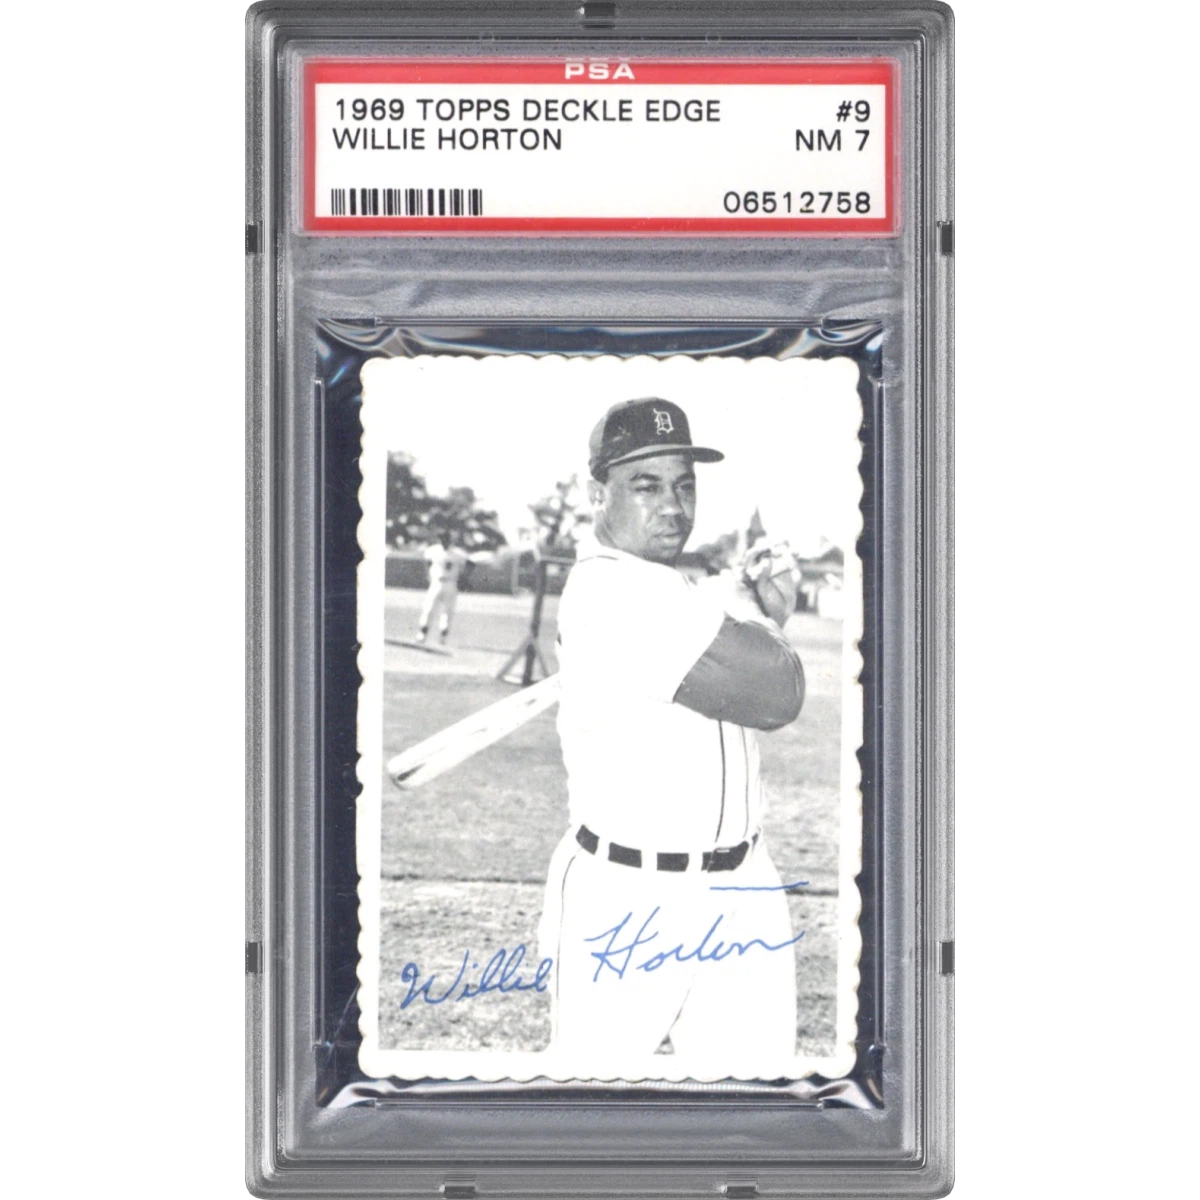 1969 Topps Deckle Edge #9 Willie Horton (PSA 7 NM)$58.501h ago
- 2025 Topps Takashi Murakami + MLB World Tour Tokyo Series #1 Shohei Ohtani (PSA 8 NM-MT)$125.801h ago
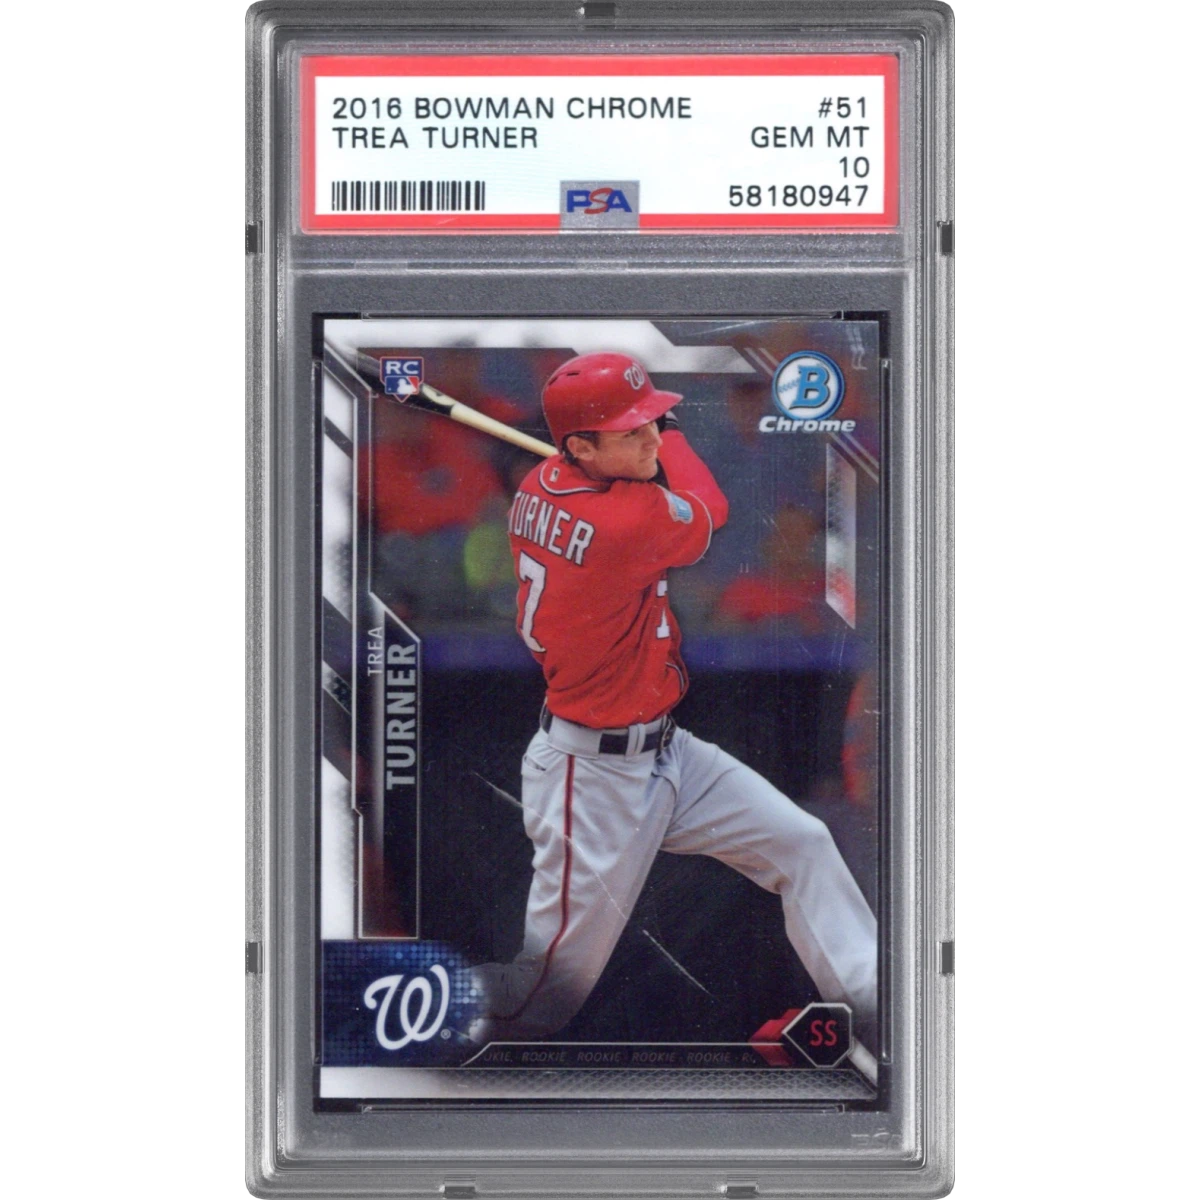 2016 Bowman Chrome #51 Trea Turner (PSA 10 GEM MINT)$46.901h ago
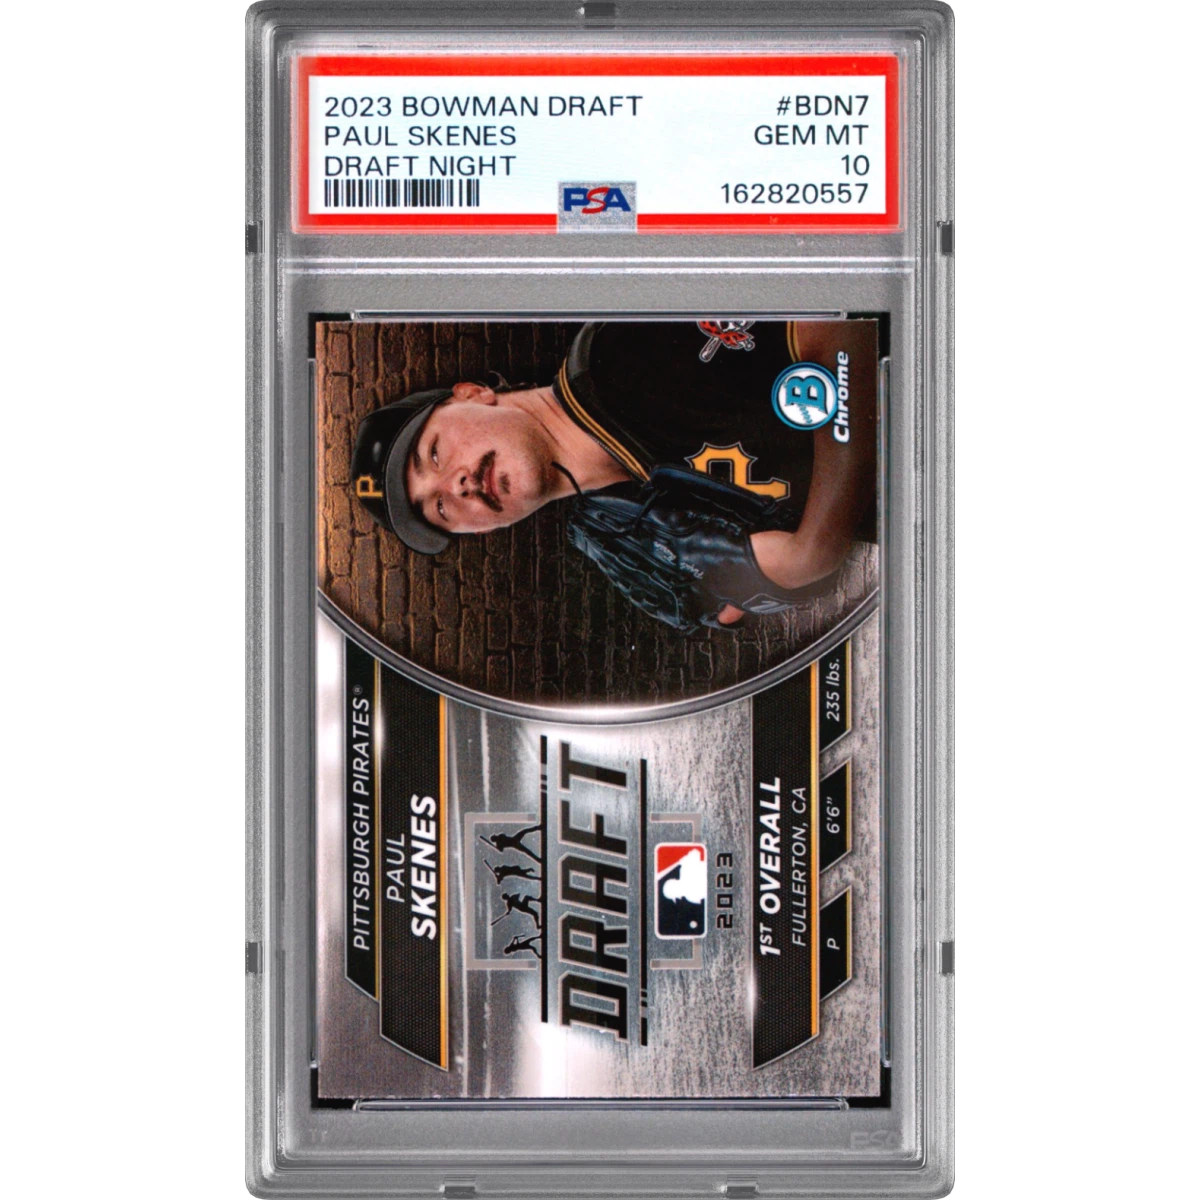 2023 Bowman Draft Bowman Draft Night #BDN7 Paul Skenes (PSA 10 GEM MINT)$65.801h ago
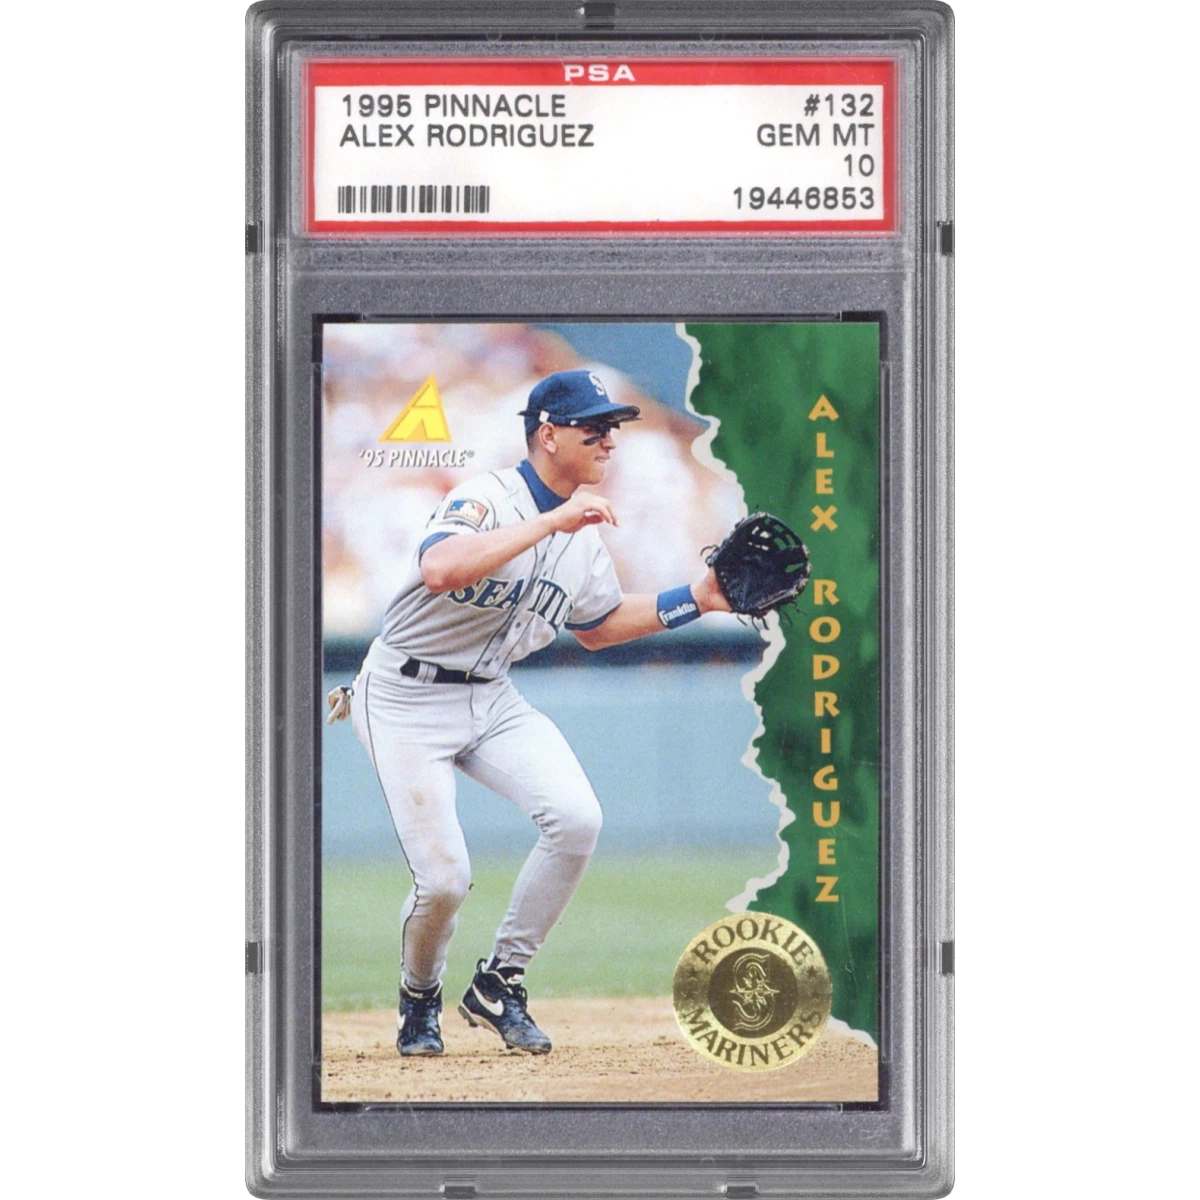 1995 Pinnacle #132 Alex Rodriguez (PSA 10 GEM MINT)$45.101h ago
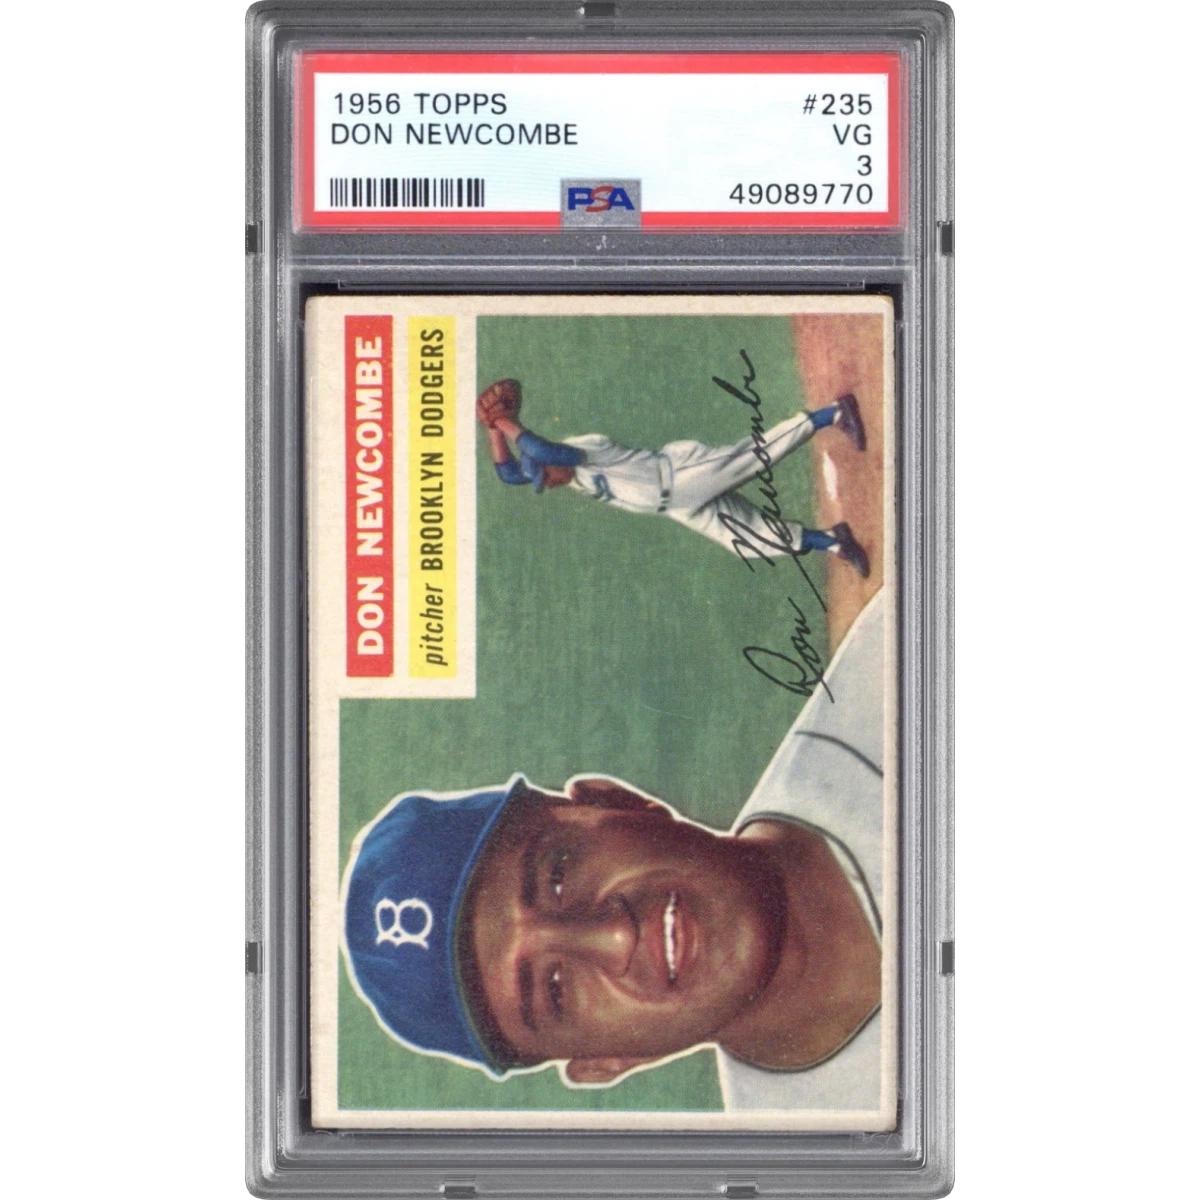 1956 Topps #235 Don Newcombe (PSA 3 VG)$45.701h ago
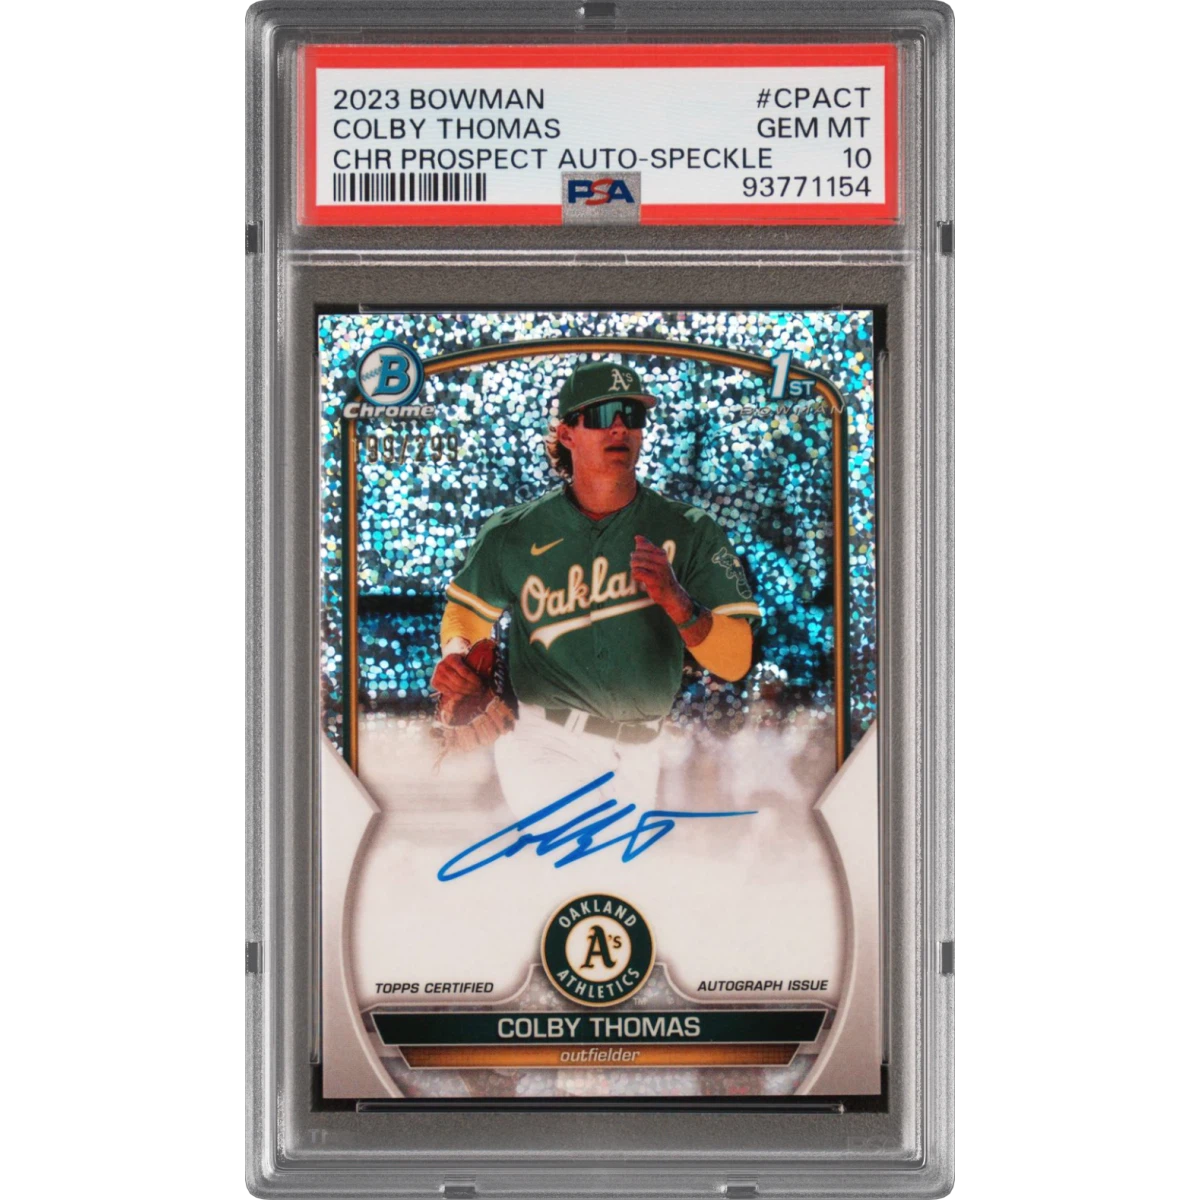 2023 Bowman Chrome Prospect Autographs #CPACT Colby Thomas - Speckle Refractor (PSA 10 GEM MINT)$59.302h ago
- 2017 Topps Chrome 1987 Topps #87T8 Aaron Judge (CGC 10 GEM MINT)$189.902h ago
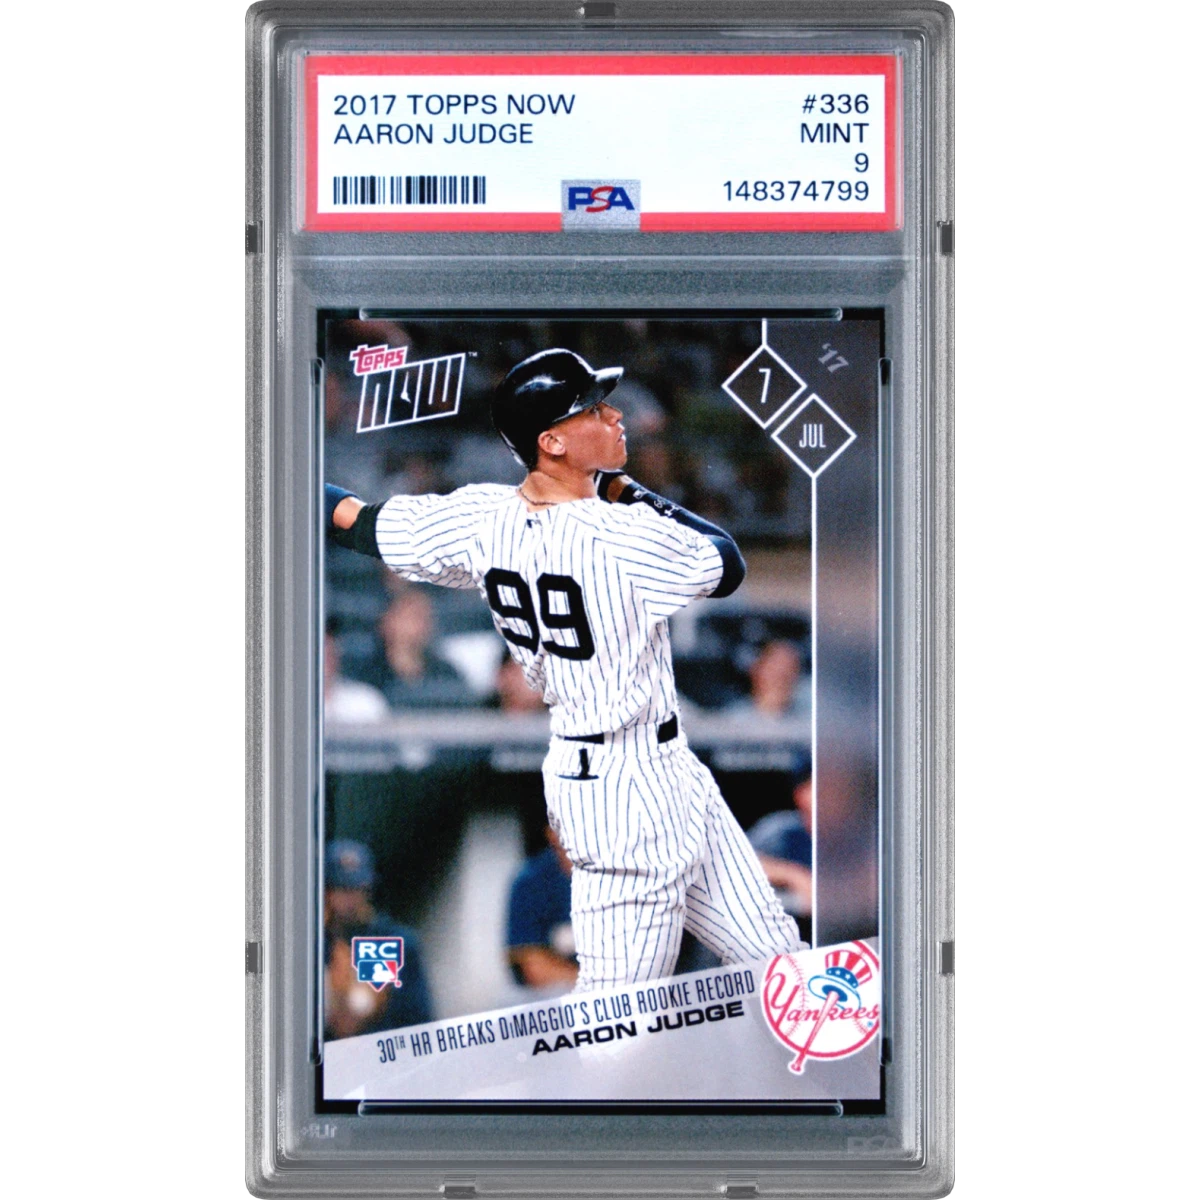 2017 Topps Now #336 Aaron Judge (PSA 9 MINT)$58.202h ago
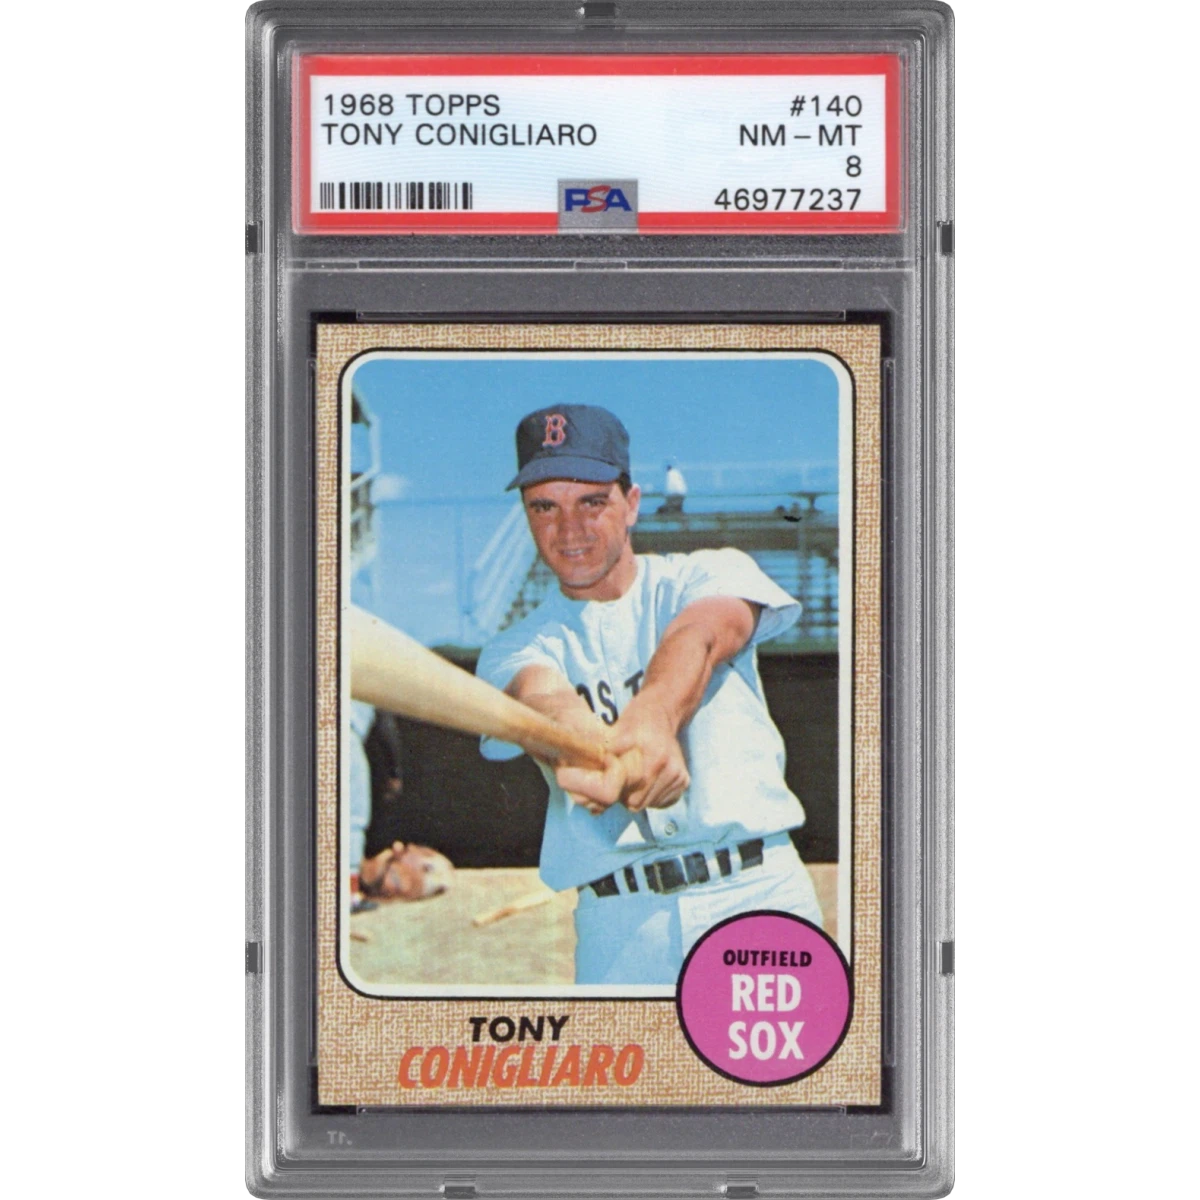 1968 Topps #140 Tony Conigliaro (PSA 8 NM-MT)$67.402h ago
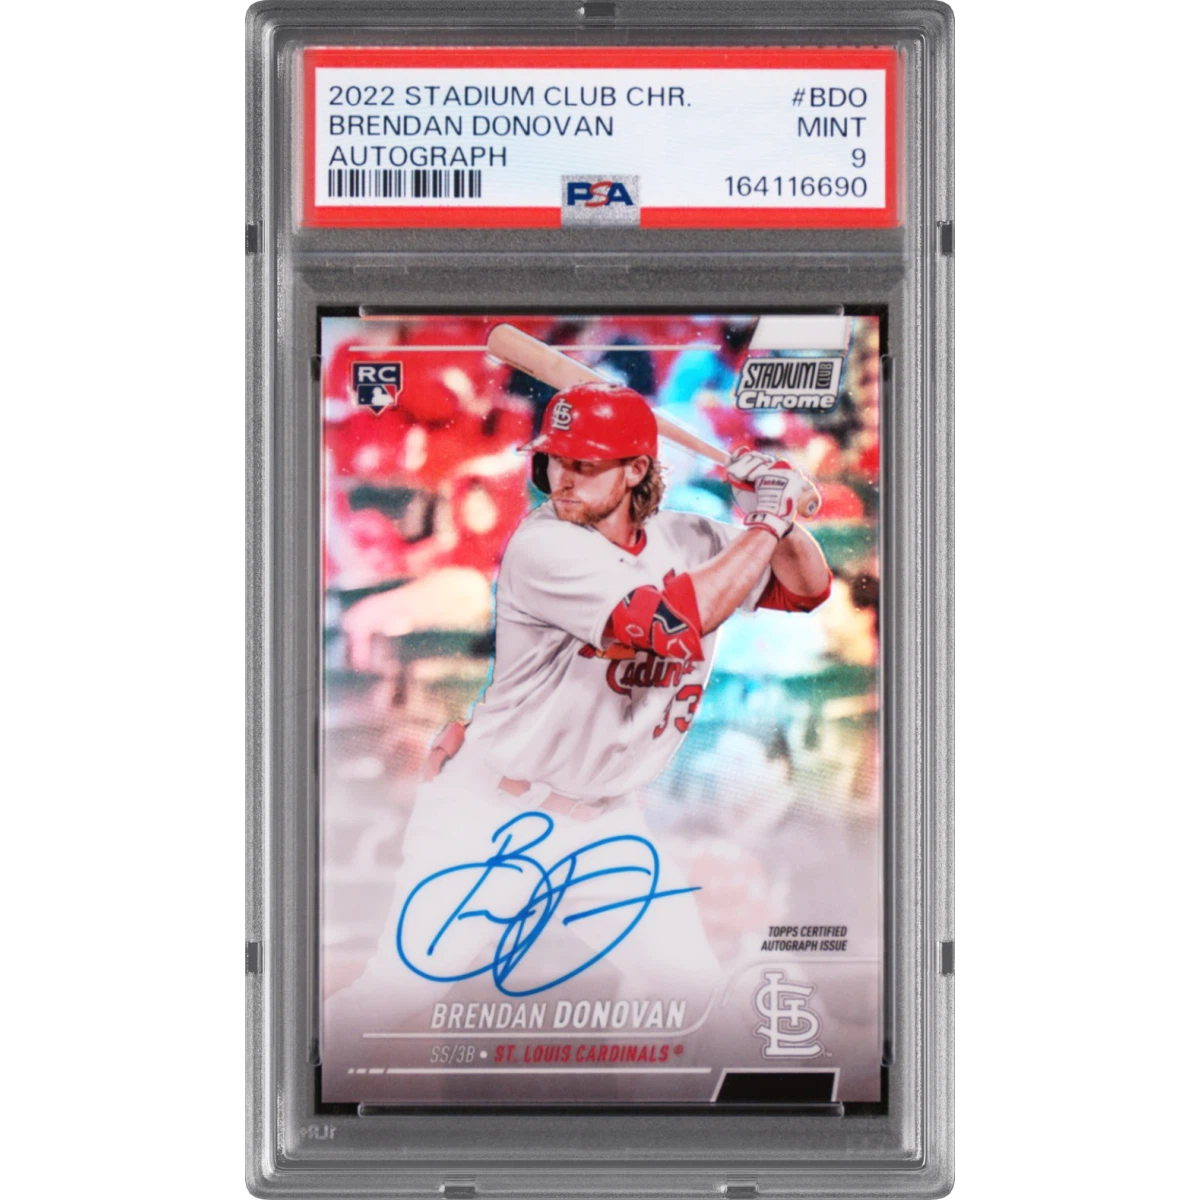 2022 Topps Stadium Club Chrome Autographs #BDO Brendan Donovan (PSA 9 MINT)$51.202h ago
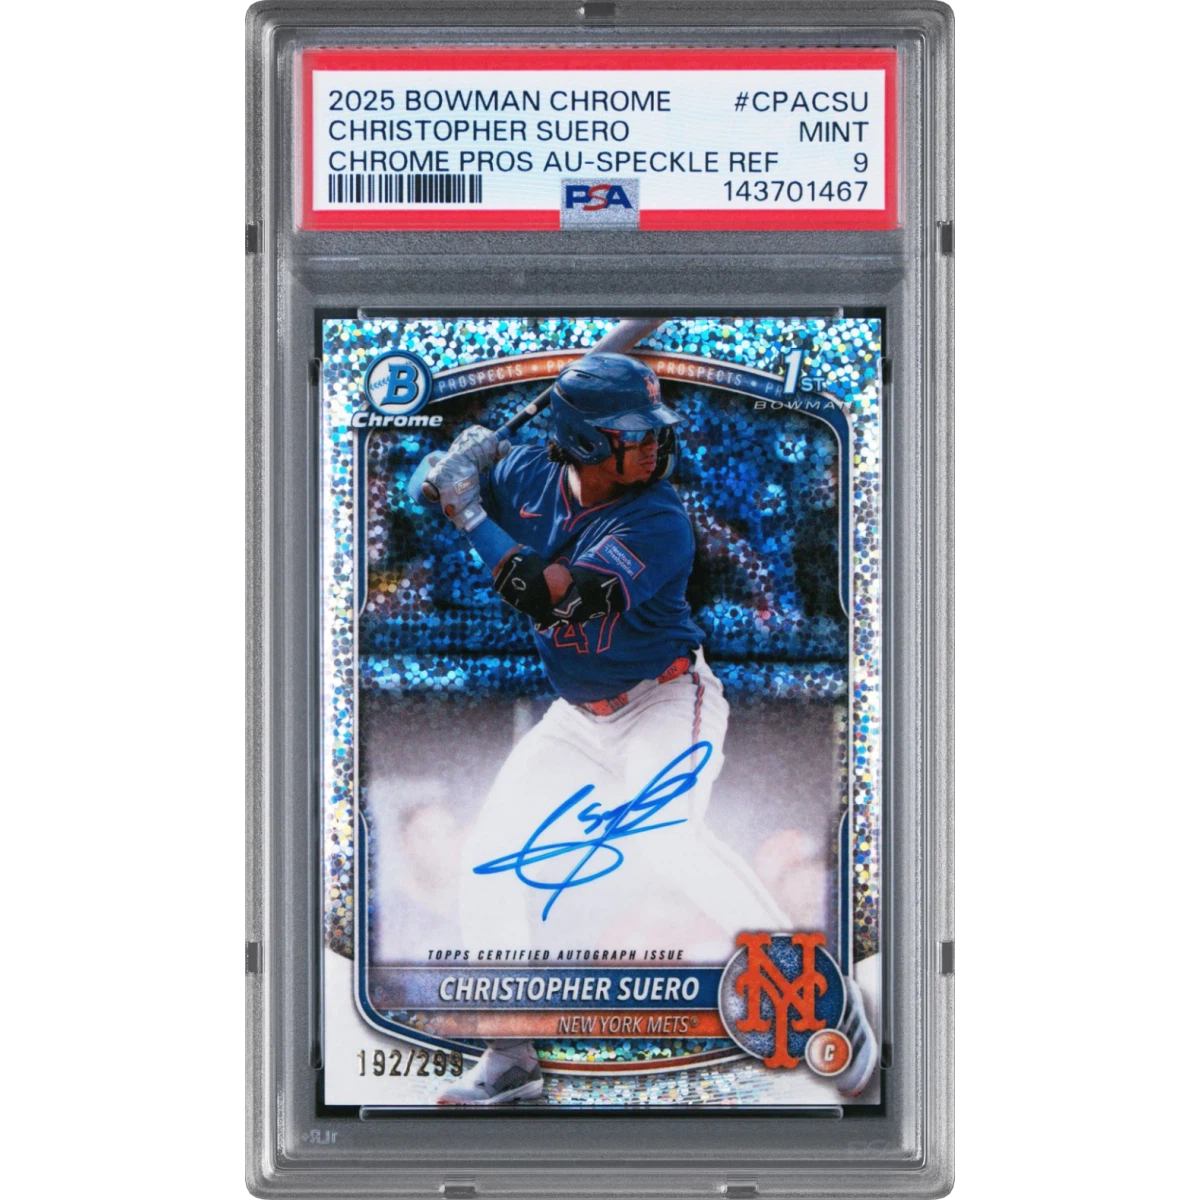 2025 Bowman Chrome Prospect Autographs #CPACSU Christopher Suero - Speckle Refractor (PSA 9 MINT)$58.702h ago
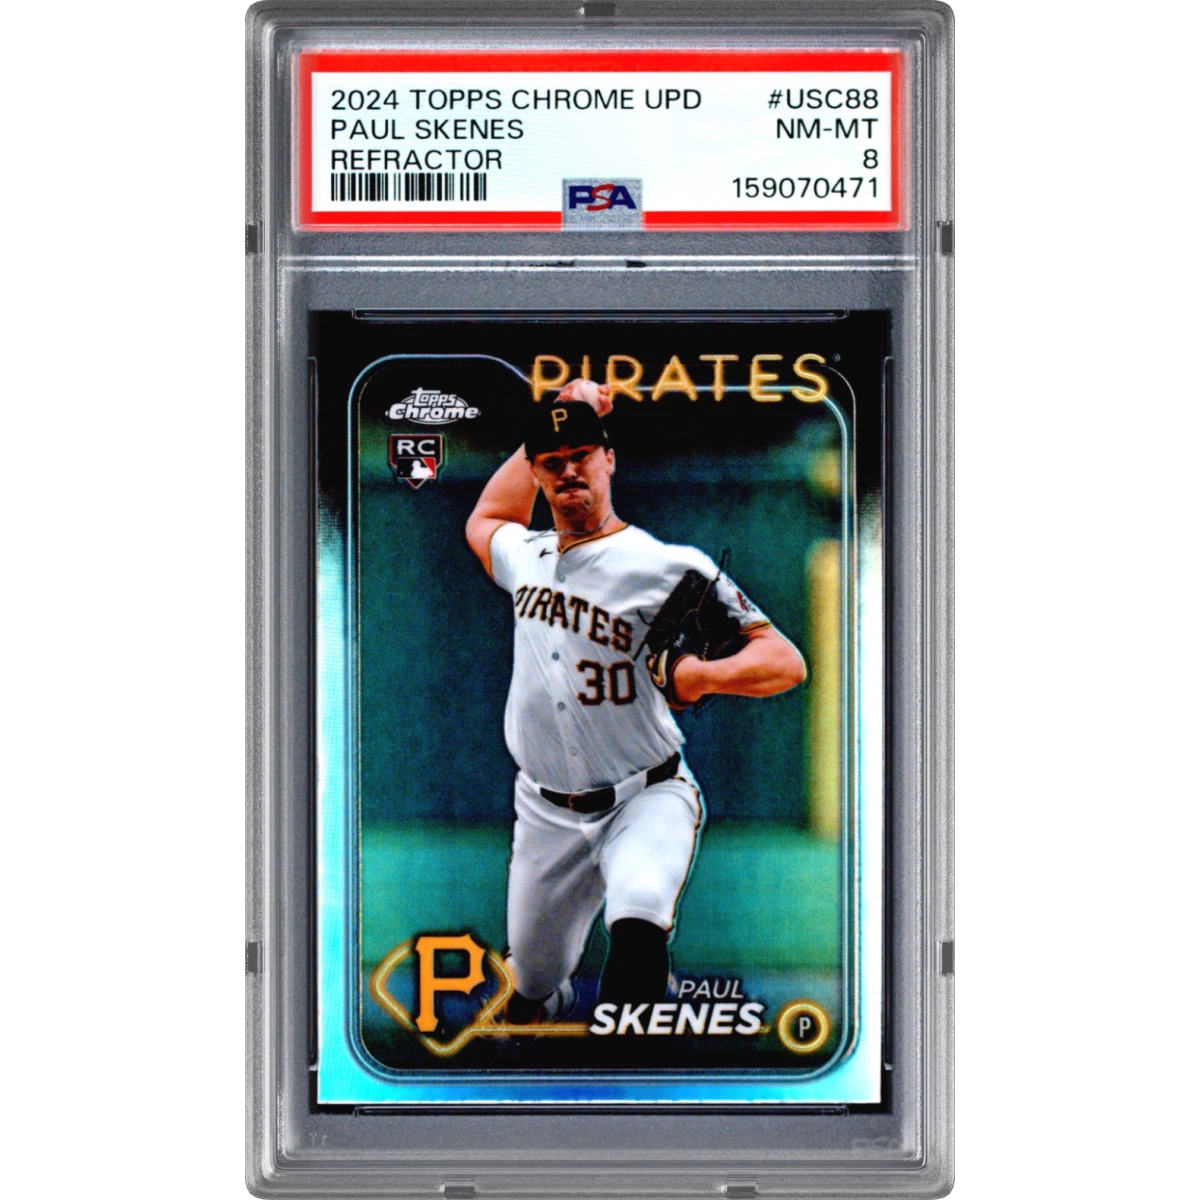 2024 Topps Chrome Update #USC88 Paul Skenes - Refractor (PSA 8 NM-MT)$45.102h ago
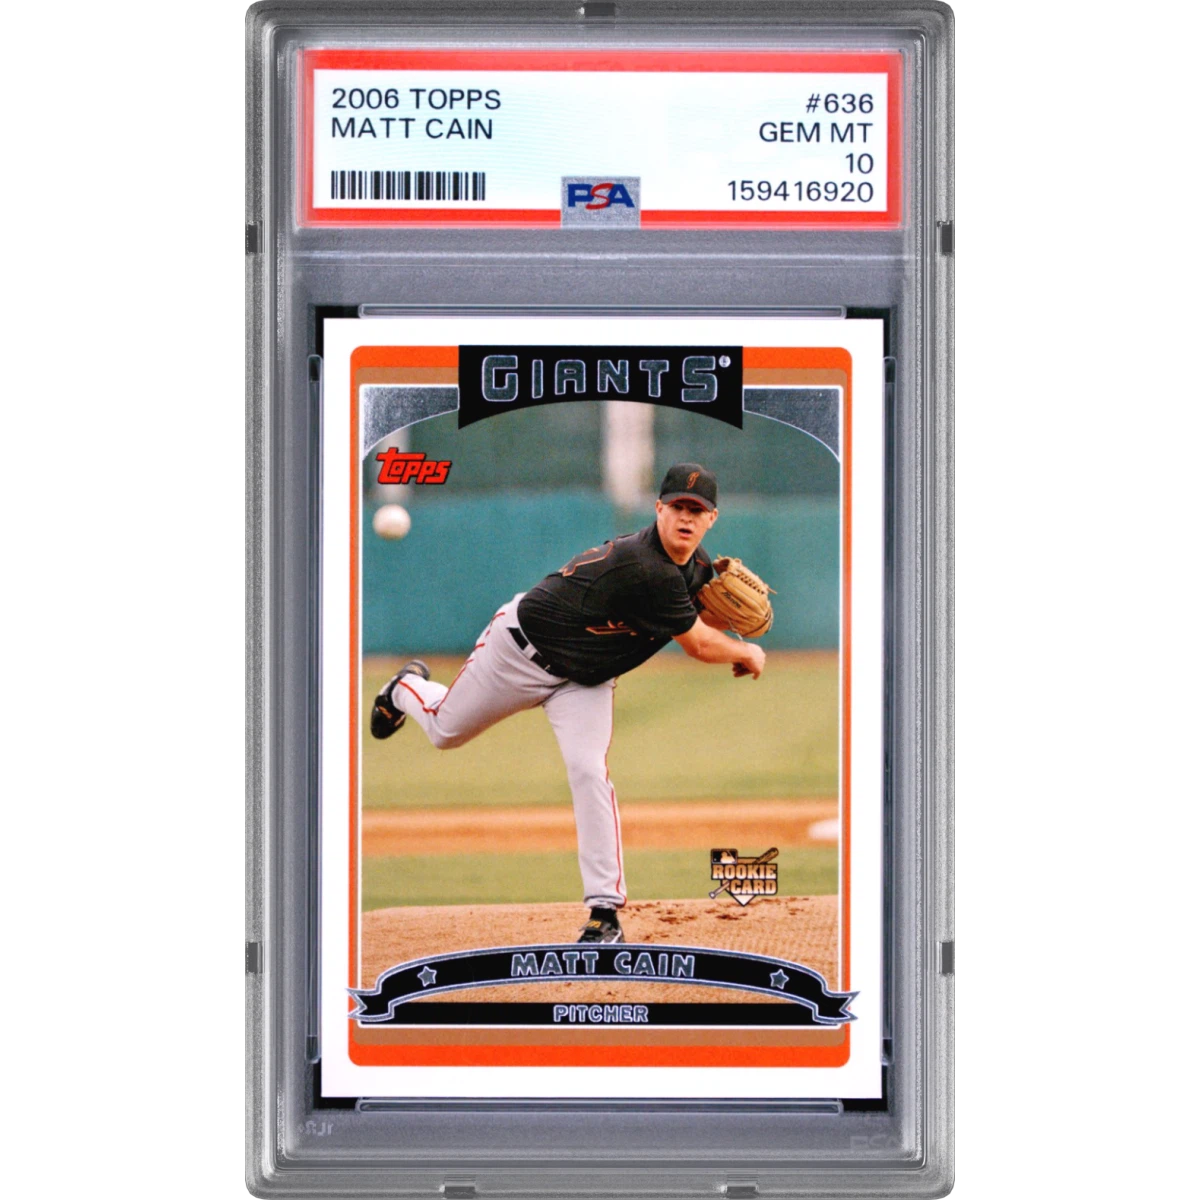 2006 Topps #636 Matt Cain (PSA 10 GEM MINT)$54.202h ago
- 1959 Topps #422 Hobie Landrith (PSA 9 MINT)$160.003h ago
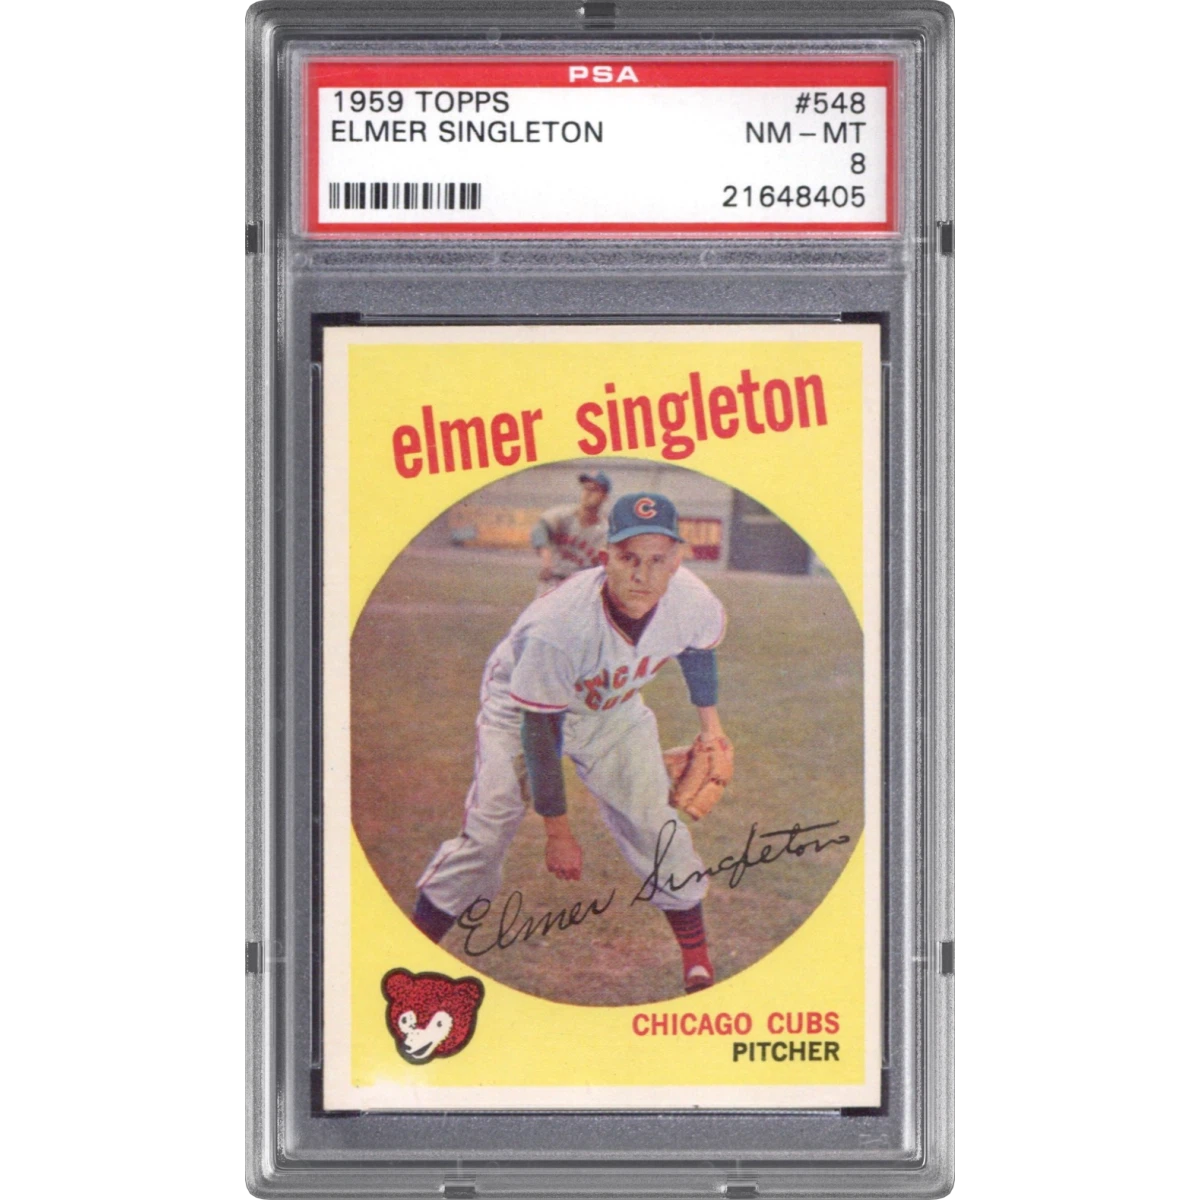 1959 Topps #548 Elmer Singleton (PSA 8 NM-MT)$122.003h ago
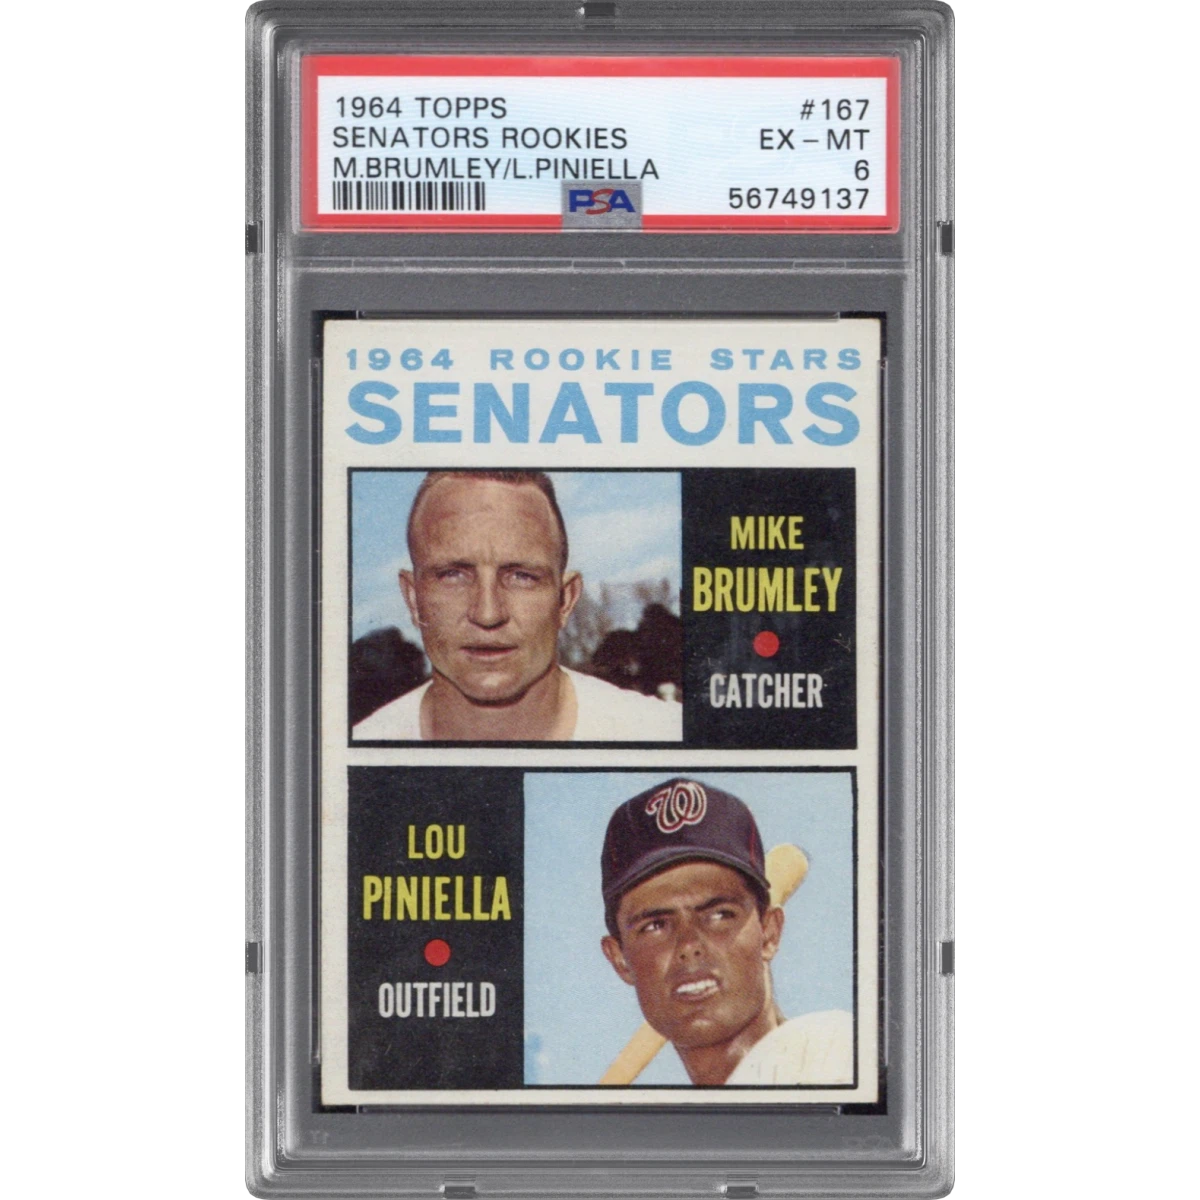 1964 Topps #167 Senators Rookies - M.Brumley/L.Piniella (PSA 6 EX-MT)$50.803h ago
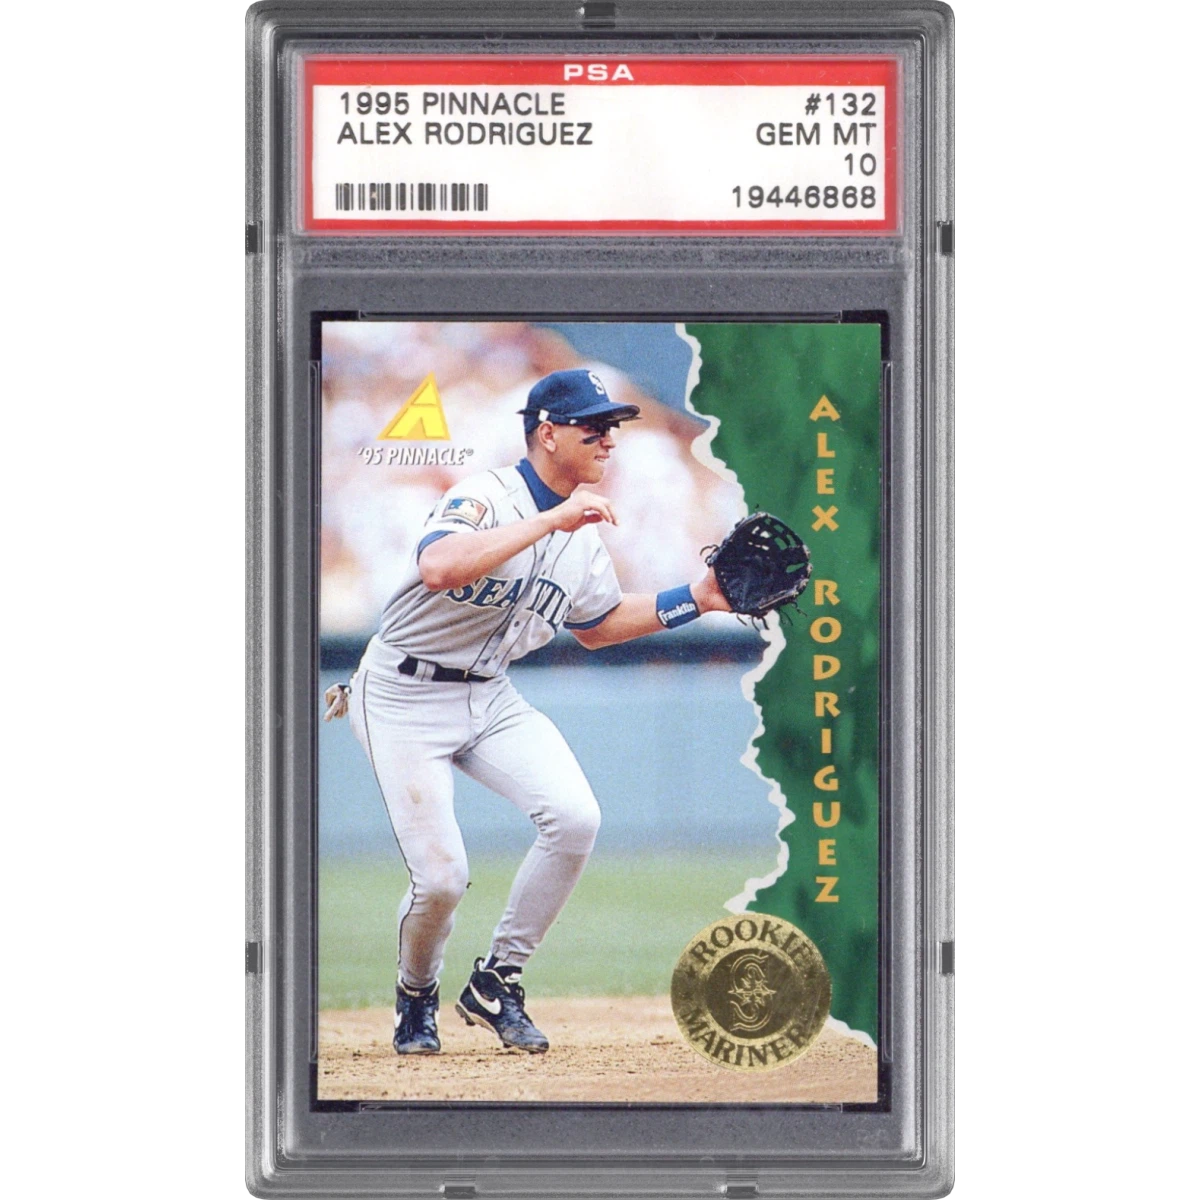 1995 Pinnacle #132 Alex Rodriguez (PSA 10 GEM MINT)$45.103h ago
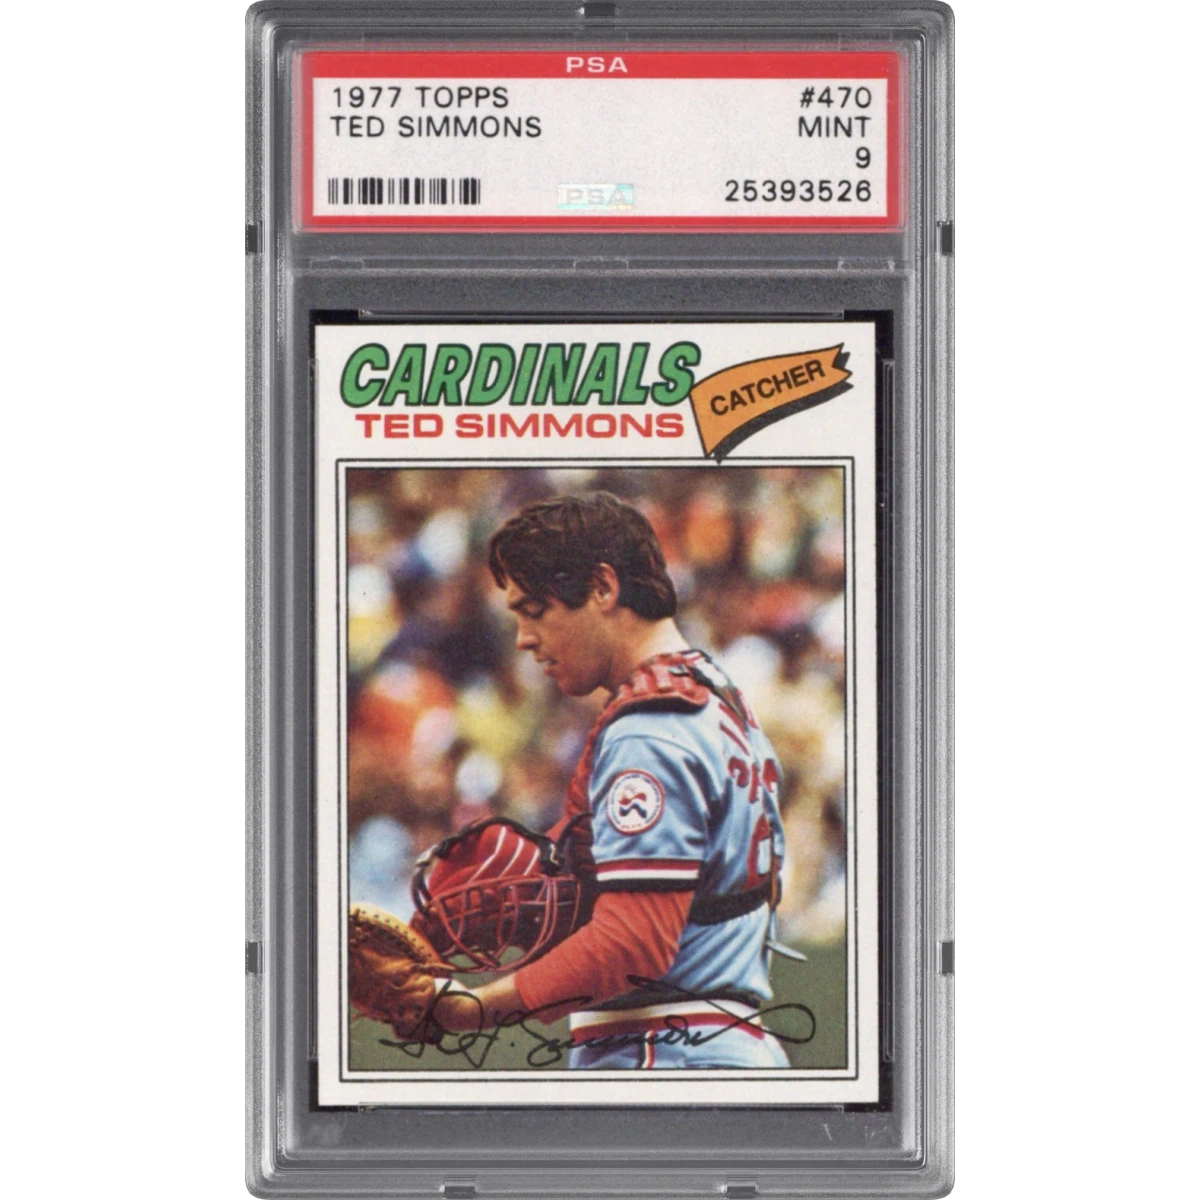 1977 Topps #470 Ted Simmons (PSA 9 MINT)$50.803h ago
- 1961 Topps #576 Roger Maris - All-Star (CSG 6 EX-NM)$161.003h ago
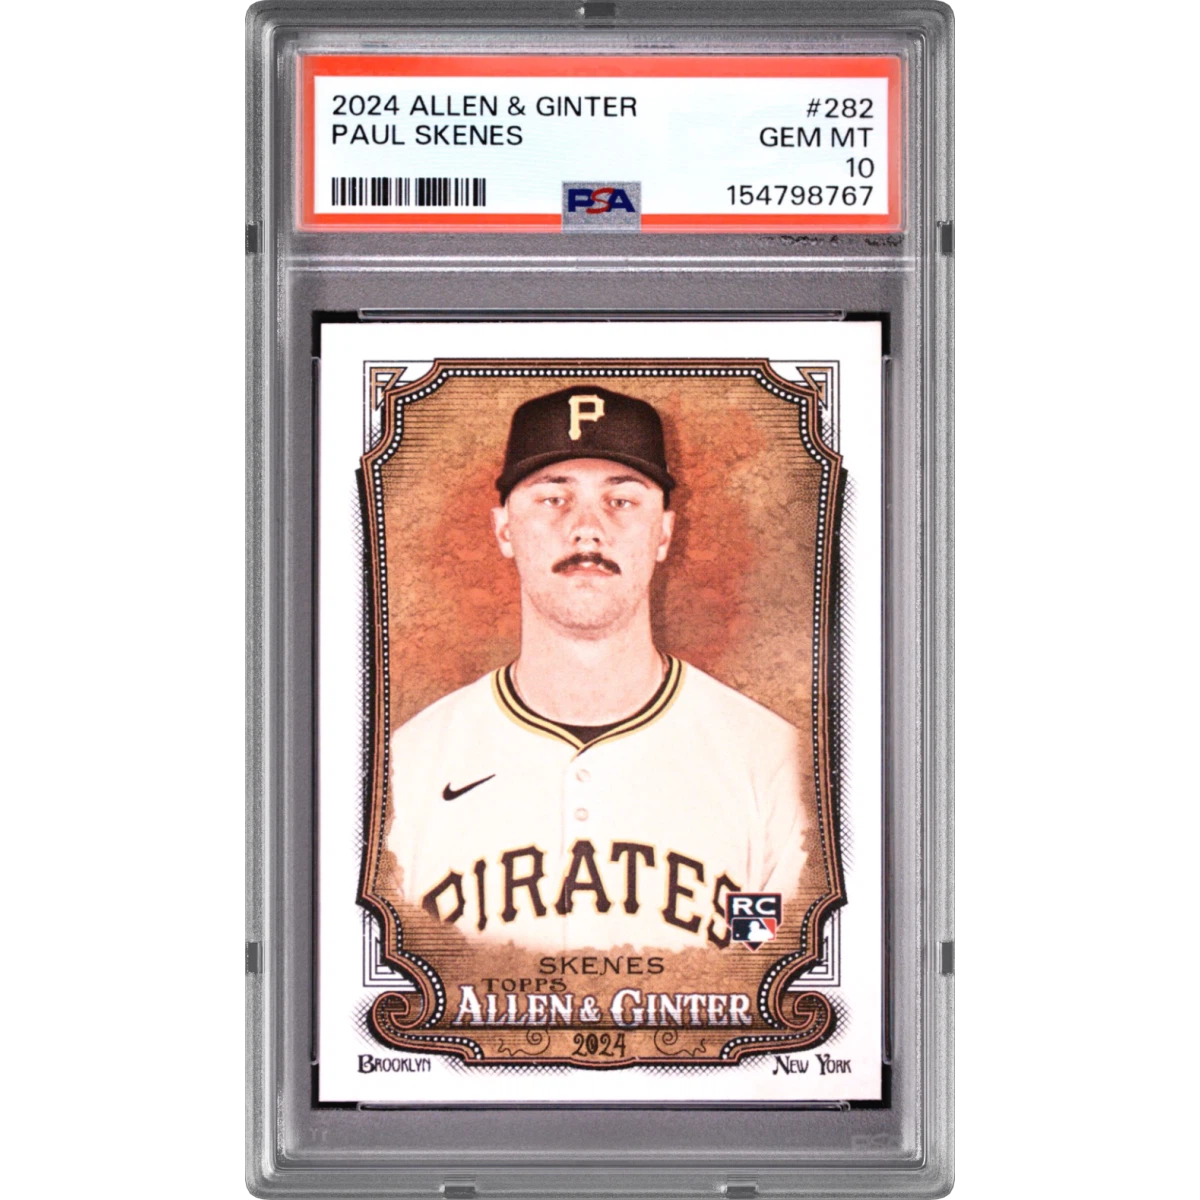 2024 Topps Allen & Ginter #282 Paul Skenes (PSA 10 GEM MINT)$44.604h ago
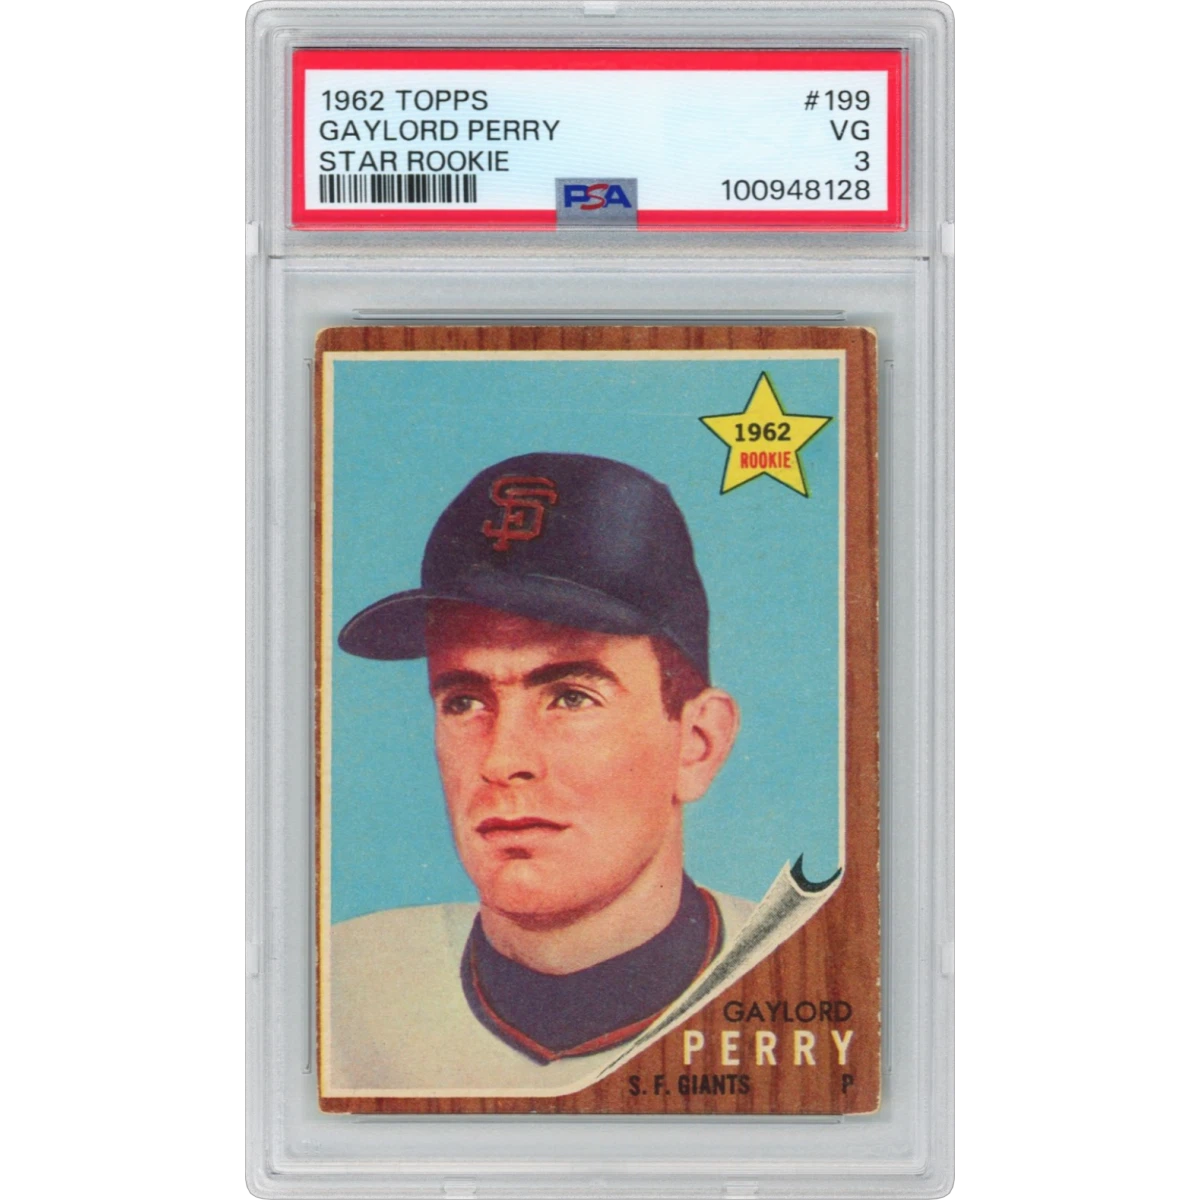 1962 Topps #199 Gaylord Perry - Star Rookie (PSA 3 VG)$50.504h ago
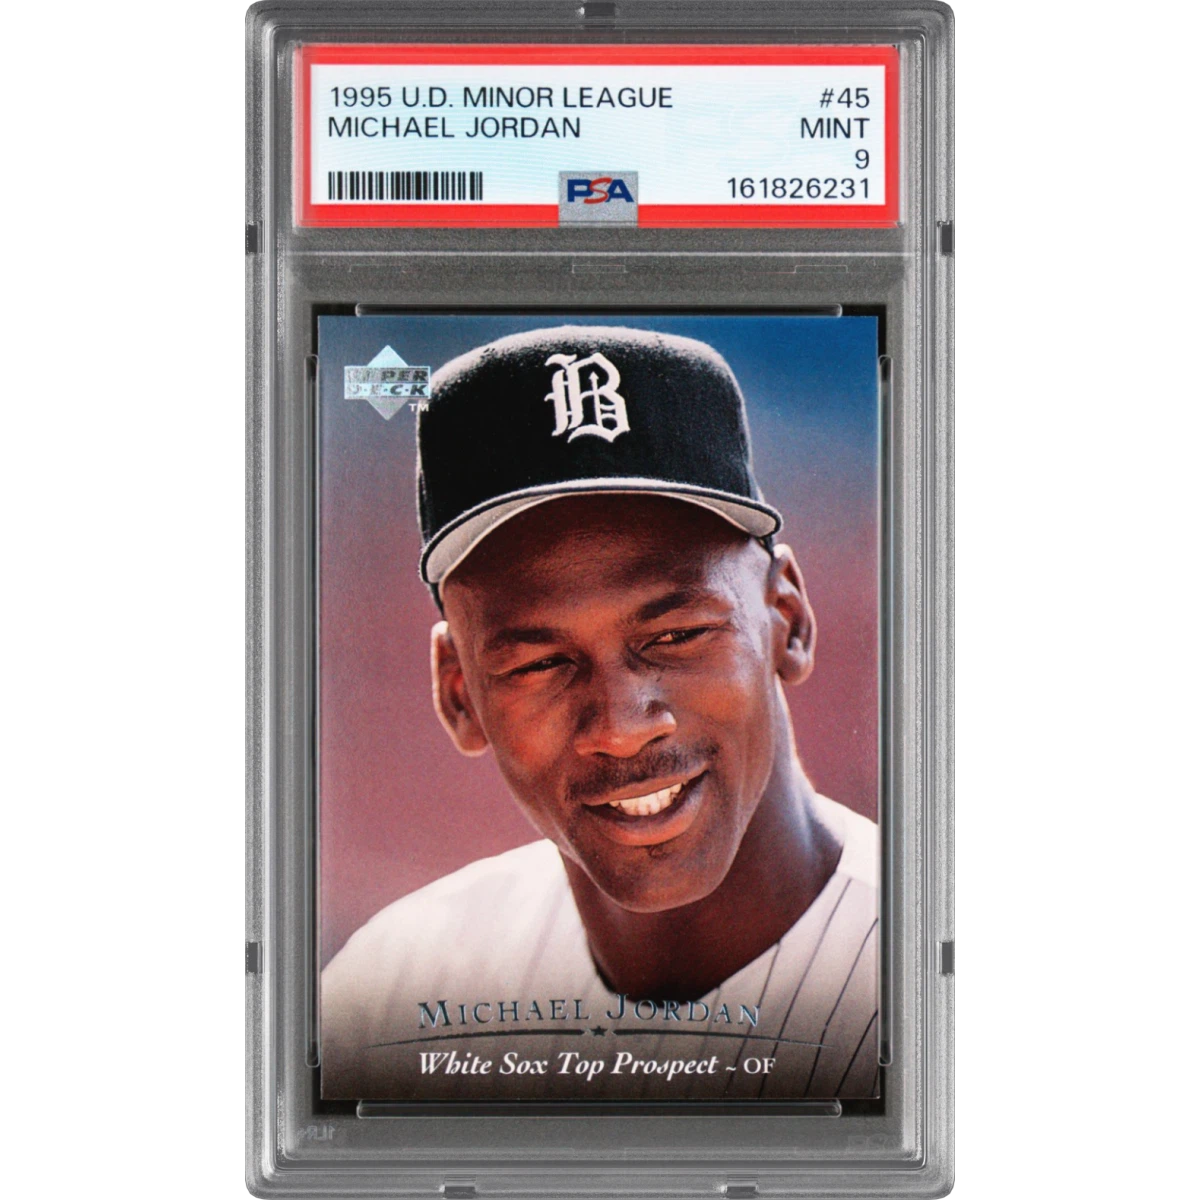 1995 Upper Deck Minor League #45 Michael Jordan (PSA 9 MINT)$94.604h ago
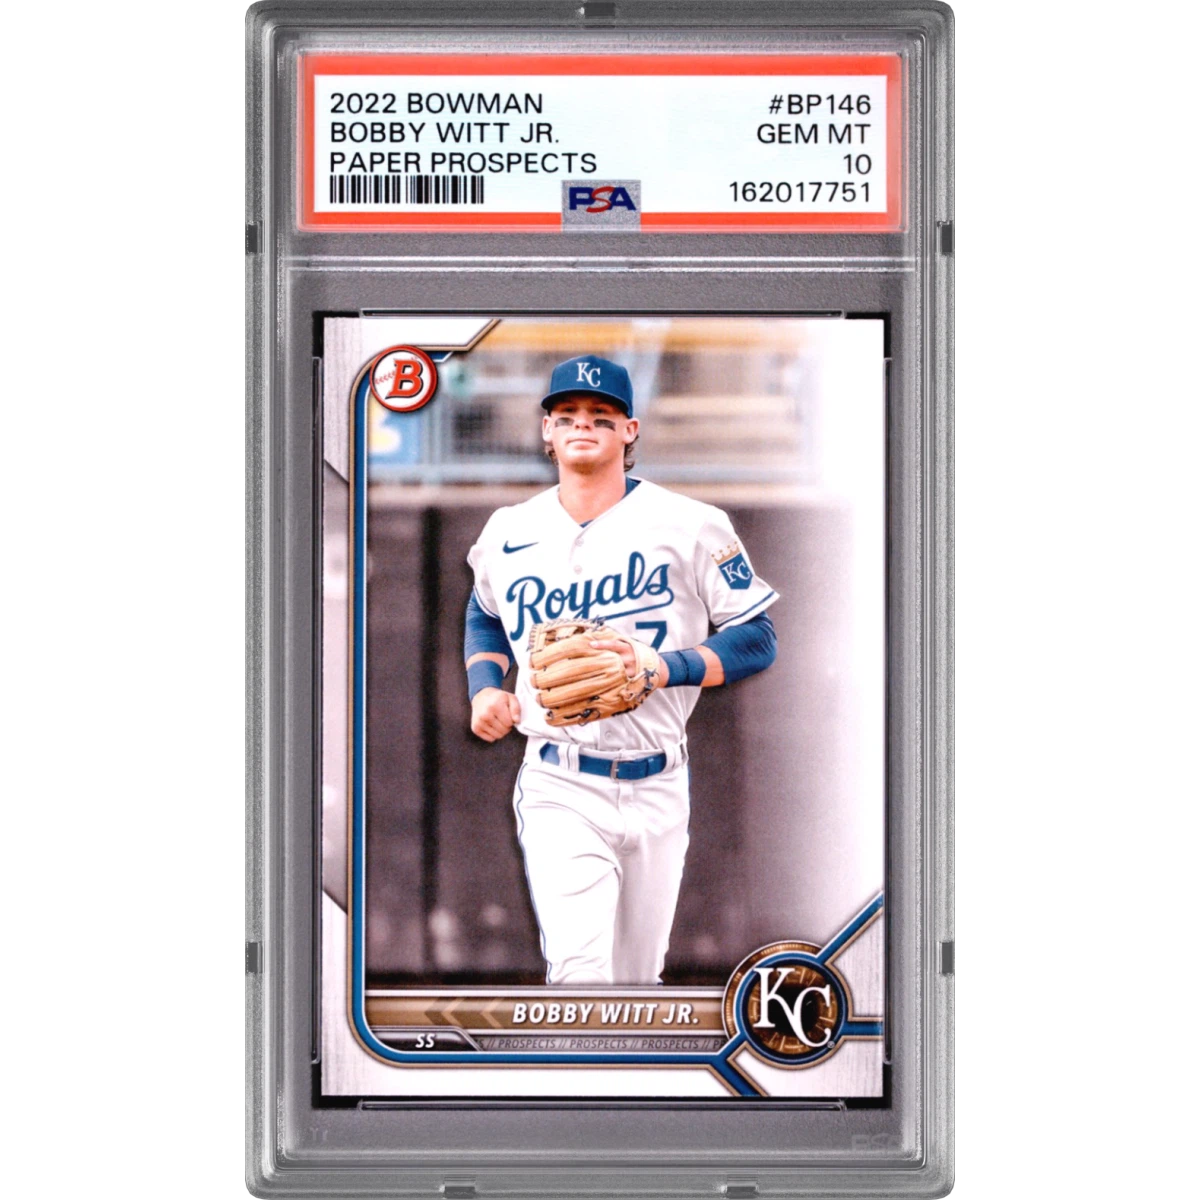 2022 Bowman Paper Prospects #BP146 Bobby Witt Jr. (PSA 10 GEM MINT)$47.804h ago
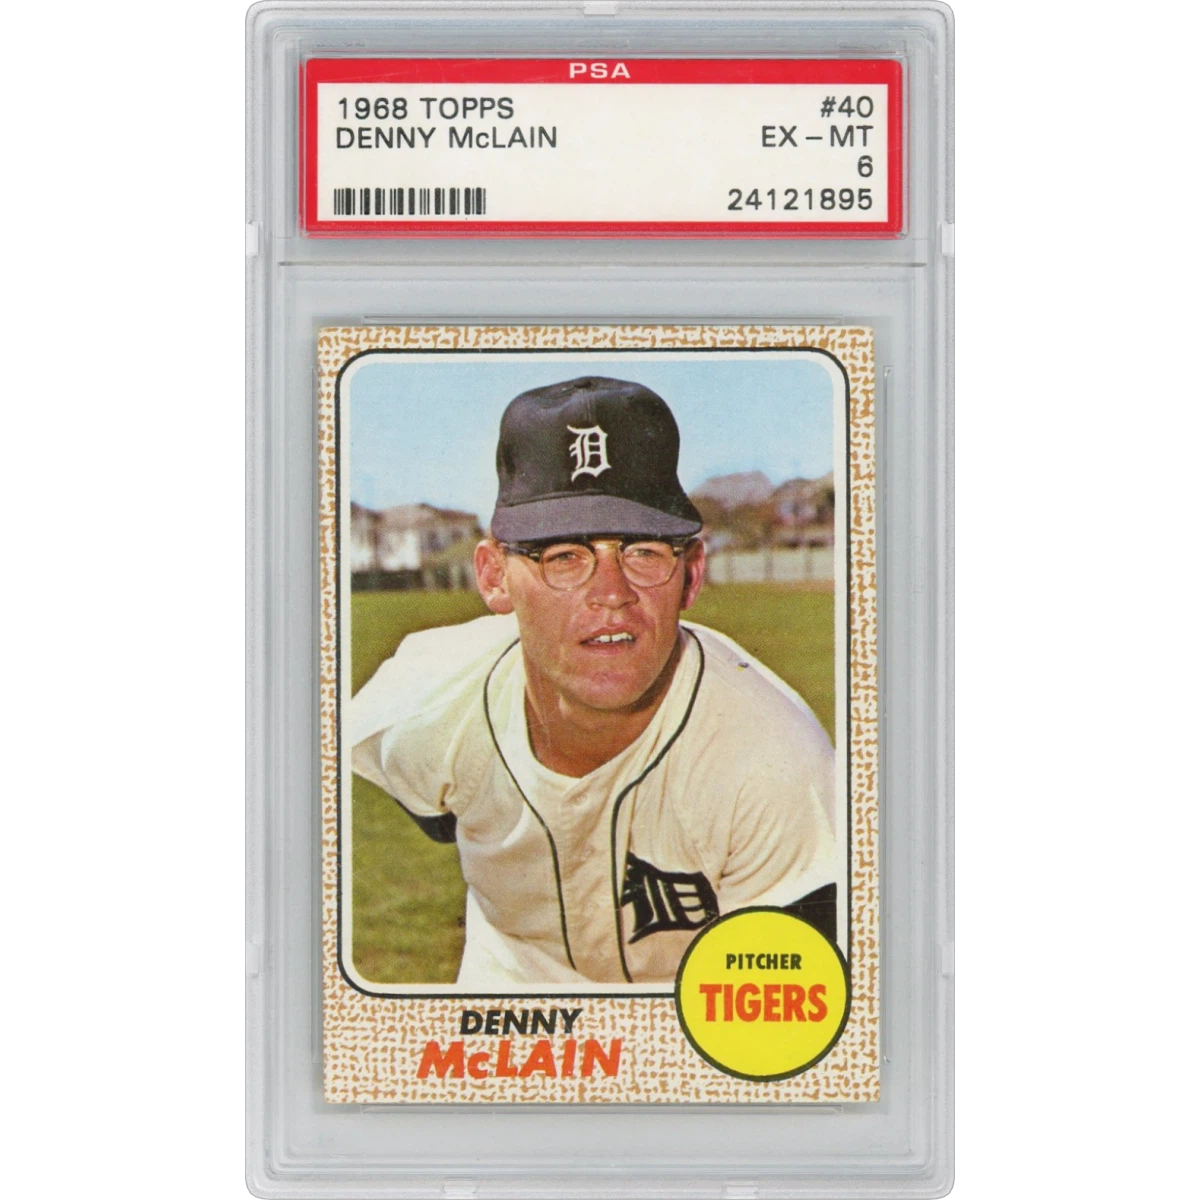 1968 Topps #40 Denny McLain (PSA 6 EX-MT)$50.305h ago
- Free shows the latest 25 pulls. Pro unlocks the full history + CSV export →
Compare Baseball October Royalty with other Baseball packs
Same math, same methodology — cash-out ratios after each pack's own buyback, so the comparison is apples to apples.
- Baseball Mythic Pack0.906x cash-out · EV $5,354 · hit rate 50.0%HOUSE EDGE
- Baseball Legend Pack1.119x cash-out · EV $3,307 · hit rate 16.7%GREAT VALUE
- Sports Legend PackEV $2,342SET PACK PRICE
- Sports VIP (Spicy)EV $1,829SET PACK PRICE
- Sports 2: ReaperEV $1,232SET PACK PRICE
- Baseball Diamond Pack0.831x cash-out · EV $983 · hit rate 38.5%HOUSE EDGE
Understand these numbers
Every figure on this page — EV, EV ratio, hit rate, dilution — is defined once and computed the same way for every pack.